|

NZD/USD extends losses, bullish momentum fades further

  • NZD/USD slides lower by 0.25% on Thursday, extending its losing streak.
  • Selling pressure gains pace as the RSI and MACD indicate a potential reversal.
  • Pair continues trading in the 20-day and 200-day SMA channels.

In Thursday's session, the NZD/USD pair declined to 0.5985, extending its losing streak to two consecutive sessions. The pair has been trading within a narrow range between the 200-day Simple Moving Average (SMA) and the 20-day SMA which are serving as support and resistances.

On the daily chart, the Relative Strength Index (RSI) is currently around 49, but points down while the MACD is showing decreasing green bars, signaling decreasing bullish momentum. This suggests that the selling pressure is increasing and a potential reversal could be on the horizon.

NZD/USD daily chart

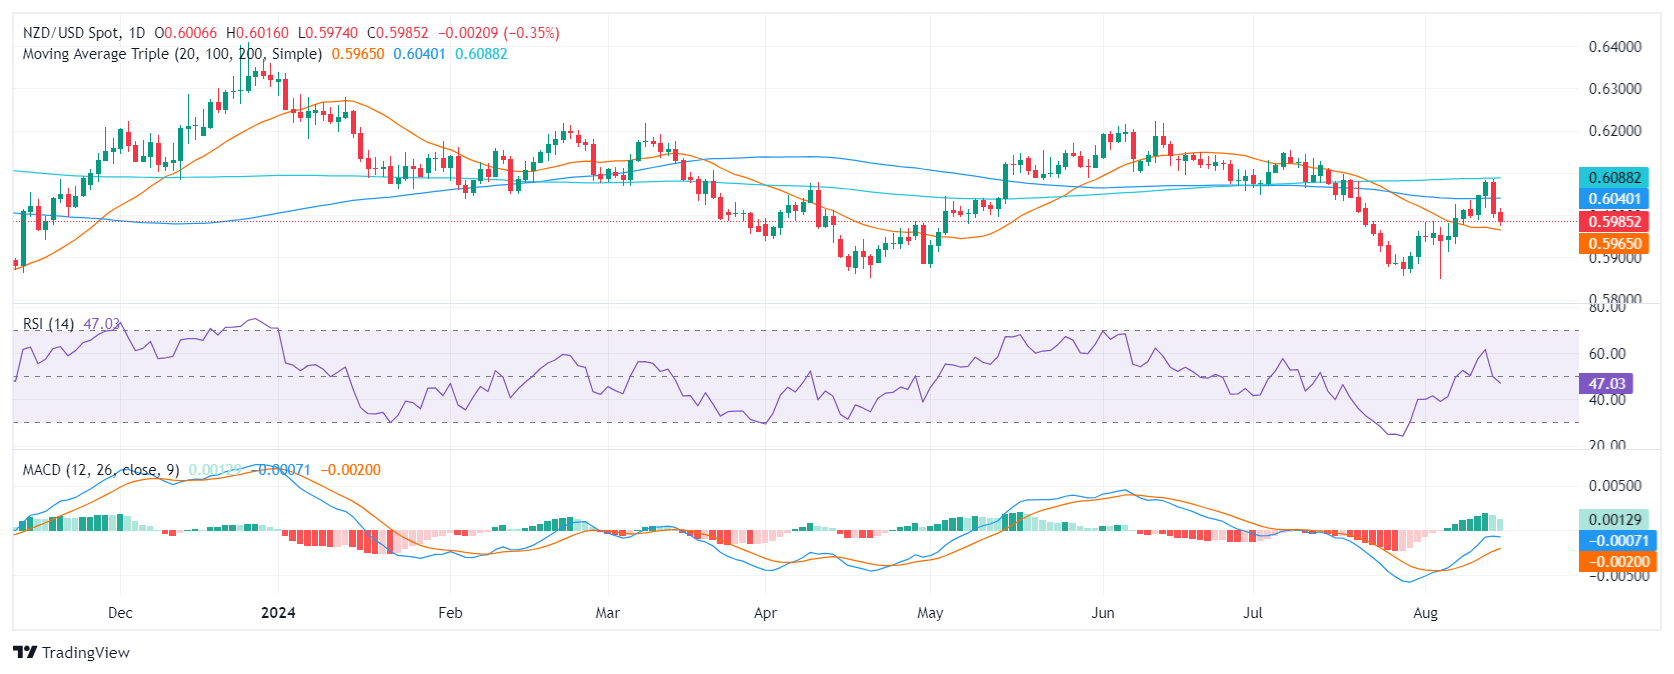
On the daily chart, the NZD/USD pair is facing immediate support at 0.5980. A break below this level could open the door for a deeper correction towards 0.5960 and 0.5930 (20-day SMA). On the upside, resistance lies at 0.6000, 0.6040(100-day SMA) and 0.6100 (200-day SMA). Traders should monitor any brakes above or below the mentioned SMAs as they could trigger sharp movements.

Author

Patricio Martín

Patricio is an economist from Argentina passionate about global finance and understanding the daily movements of the markets.

More from Patricio Martín
Share:

Editor's Picks

EUR/USD seems fragile below 1.1700 as Middle East war boosts energy prices

The EUR/USD pair trades flat at around 1.1680 during the Asian trading session on Tuesday, but broadly seems vulnerable, being close to its five-week low. The major currency pair is under pressure as surging oil prices due to the United States-Israel war with Iran have increased the risks of higher inflation for the Old Continent.

GBP/USD hovers around 1.3400 with bearish pressure intact

GBP/USD edges higher after three days of losses, trading around 1.3400 during the Asian hours on Tuesday. The technical analysis of the daily chart indicates an ongoing bearish bias, as the pair trades within a descending channel pattern.

Gold sticks to gains above $5,350 amid sustained safe-haven demand; firmer USD caps gains

Gold sticks to its positive bias for the third straight day and trades above the $5,350 level heading into the European session on Tuesday. Concerns about a broader regional conflict in the Middle East continue to weigh on investors' sentiment and underpin demand for the traditional safe-haven bullion.

Stellar risks deeper losses as derivatives metrics turn negative

Stellar is trading red below $0.16 at the time of writing on Tuesday, after a slight recovery the previous day. Weakening derivatives data caps the recovery, while an unfavorable technical outlook projects a deeper correction for the XLM token in the upcoming days.

The market is not panicking it is repricing the probability distribution of Oil and time

At the end of the day, markets do not trade morality or geopolitics. They trade transmission channels. And the only channel that truly matters in this maelstrom runs through the price of energy and the time value of money.

Grass 20% bullish breakout defies broader market weakness

Grass (GRASS) is edging up above $0.30 at the time of writing on Monday. The token’s notable 20% intraday surge stands out amid heightened volatility in the broader crypto market.