Nvidia Stock Forecast: NVDA edges near resistance at overhead trend line
- NVDA shares rose 1.1% on Wednesday on low volume.
- Nvidia stock is near a top trend line resistance at $302.12.
- Bank of America survey says 66% of investors are overweight semiconductors.
Nvidia (NVDA) shares rose more than 1% on Thursday's open before slumping half an hour into the session. NVDA stock is nearing the top trend line that has been shepharding the price lower since November 22.* The descending trend line sits at $302.12 on Thursday, while NVDA shares trade around $296.
Nvidia Stock News: investors are overweights semiconductors going into 2022
A number of interesting statistics came out of a Bank of America investor survey on Wednesday. The survey found that 66% of investors are overweight semiconductors, and consensus says the semiconductor index will beat the S&P 500 by 5% in 2022.
Investors in the survey were the most bullish on Micron Technology (MU), Marvell Technology (MRVL) and Nvidia among semiconductor stocks. Texas Instruments (TXN) and Intel (INTC) had the most bearish sentiment. NVDA also was a fairly popular choice for shorts.
On Tuesday, UBS released a report on the most and least crowded large cap trades for December. While Nvidia partner Meta Platforms (FB) made it onto the most crowded list, Nvidia ranked fifth on the least crowded. Nvidia has lost nearly 10% of its share price in December thus far.
Nvidia released a list of products that use Apache Log4j and need to be updated to protect from Log4Shell attacks that have appeared worldwide.
NVDA key statistics
| Market Cap | $755 billion |
| Price/Earnings | 93 |
| Price/Sales | 32 |
| Price/Book | 32 |
| Enterprise Value | $747 billion |
| Operating Margin | 35% |
| Profit Margin |
34% |
| 52-week high | $346.47 |
| 52-week low | $115.67 |
| Short Interest | 1% |
| Average Wall Street Rating and Price Target | Buy, $339.86 |
Nvidia Stock Forecast: resistance at $302
Nvidia stock has traded within a descending price channel since November 22. With the current upper trend line sitting at $302.12, it would seem that now is not the time to enter the stock. Breaking above the price channel's top line would, however, signal an entry point. NVDA shares have now faced resistance at this line seven times in the past month, proving its significance.
If Nvidia once again fails to push above here, then expect shares to drop off back to the bottom trend line, which currently sits at $261.05. The Relative Strength Index (RSI) is trading sideways at 51 and shows no sign that a rally is in the works.
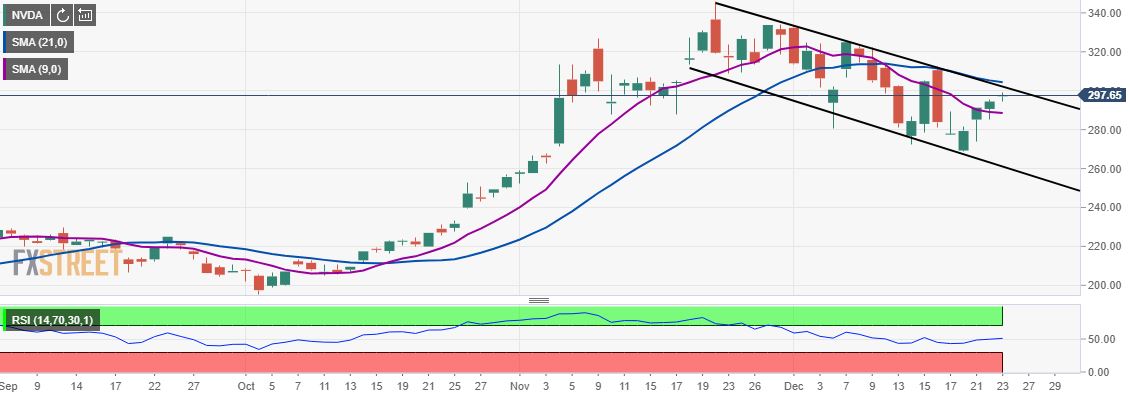
NVDA 1-day chart
*58 years to the day JFK was assassinated.
Like this article? Help us with some feedback by answering this survey:
Premium
You have reached your limit of 3 free articles for this month.
Start your subscription and get access to all our original articles.
Author

Clay Webster
FXStreet
Clay Webster grew up in the US outside Buffalo, New York and Lancaster, Pennsylvania. He began investing after college following the 2008 financial crisis.


