|

NVDA blue box offered short-term buying opportunity

In this technical blog, we will look at the past performance of 1-hour Elliott Wave Charts of NVDA. We presented to members at the elliottwave-forecast. In which, the rally from the 28 December 2023 low unfolded as an impulse structure. And showed a higher high sequence favored more upside extension to take place. Therefore, we advised members not to sell the stock & buy the dips in 3, 7, or 11 swings at the blue box areas. We will explain the structure & forecast below:

NVDA 1-hour Elliott Wave chart from 2/05/2023

NVDA

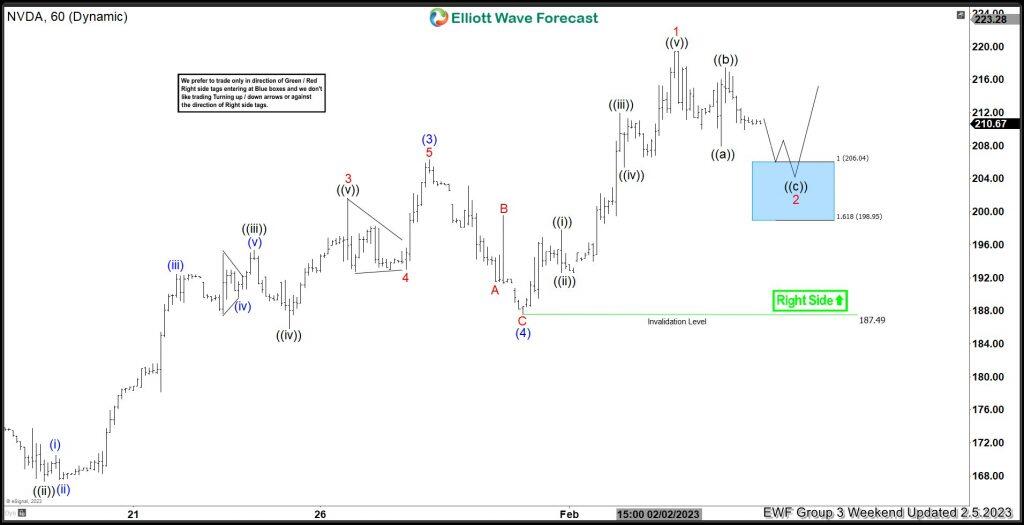
Here’s the 1hr Elliott wave chart from the 2/05/2023 Weekend update. In which, the short-term cycle from the 1/31/2023 low ended in wave 1 at $219.49 high. Down from there, the stock made a pullback in wave 2 to correct that cycle. The internals of that pullback unfolded as Elliott wave zigzag structure where wave ((a)) ended at $207.89 low. Wave ((b)) bounce ended at $217.45 high. And wave ((c)) managed to reach the blue box area at $206.04- $2198.85 equal legs area.
From there, buyers were expected to appear looking for the next leg higher or for a 3 wave bounce minimum.

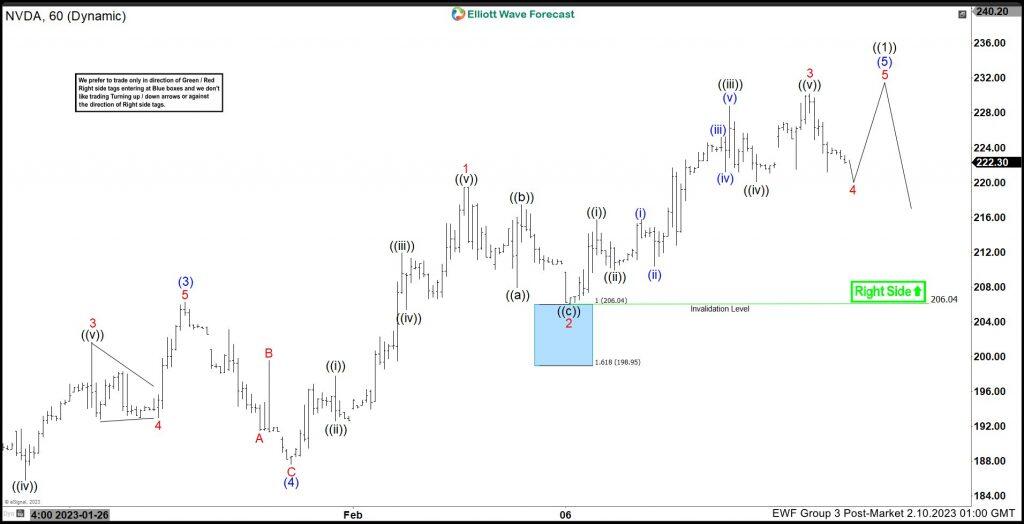
NVDA latest 1-hour Elliott Wave chart from 2/10/2023

Above is the Latest 1hr Elliott wave Chart from the 2/10/2023 Post-market update. We can see the stock is showing a strong reaction higher right after ending the zigzag correction within the blue box area. This allowed members to create a risk-free position shortly after taking the long position at the blue box area. It already made a new high above $219.49 high & confimred the next extension higher. Now as far as it remains above $206.04 low another new high towards $237- $245 area is expected to take place before entering into another pullback.

NVDA

Author

Elliott Wave Forecast Team

Elliott Wave Forecast Team

ElliottWave-Forecast.com

More from Elliott Wave Forecast Team
Share:

Markets move fast. We move first.

Orange Juice Newsletter brings you expert driven insights - not headlines. Every day on your inbox.

By subscribing you agree to our Terms and conditions.

Editor's Picks

EUR/USD holds steady below 1.1800

EUR/USD moves sideways in a narrow channel below 1.1800 as the market volatility remains low ahead of the New Year holiday. On Tuesday, investors will pay close attention to the minutes of the Federal Reserve's December policy meeting.

GBP/USD retreats below 1.3500 as trading conditions remain thin

GBP/USD corrects lower after posting strong gains in the previous week and trades below 1.3500 on Monday. With the action in financial markets turning subdued following the Christmas holiday, however, the pair's losses remain limited.

Gold holds above $4,300 after setting yet another record high

Spot Gold traded as high as $4,550 a troy ounce on Monday, fueled by persistent US Dollar weakness and a dismal mood. The XAU/USD pair was hit sharply by profit-taking during US trading hours and retreated towards $4,300, where buyers reappeared.

Crypto market outlook for 2026

Year 2025 was volatile, as crypto often is.  Among positive catalysts were favourable regulatory changes in the U.S., rise of Digital Asset Treasuries (DAT), adoption of AI and tokenization of Real-World-Assets (RWA).

Economic outlook 2026-2027 in advanced countries: Solidity test

After a year marked by global economic resilience and ending on a note of optimism, 2026 looks promising and could be a year of solid economic performance. In our baseline scenario, we expect most of the supportive factors at work in 2025 to continue to play a role in 2026.

Crypto market outlook for 2026

Year 2025 was volatile, as crypto often is.  Among positive catalysts were favourable regulatory changes in the U.S., rise of Digital Asset Treasuries (DAT), adoption of AI and tokenization of Real-World-Assets (RWA).