NTPC Indian Stocks Elliott Wave technical analysis [Video]
![NTPC Indian Stocks Elliott Wave technical analysis [Video]](https://editorial.fxsstatic.com/images/i/car-industry-02.jpg)
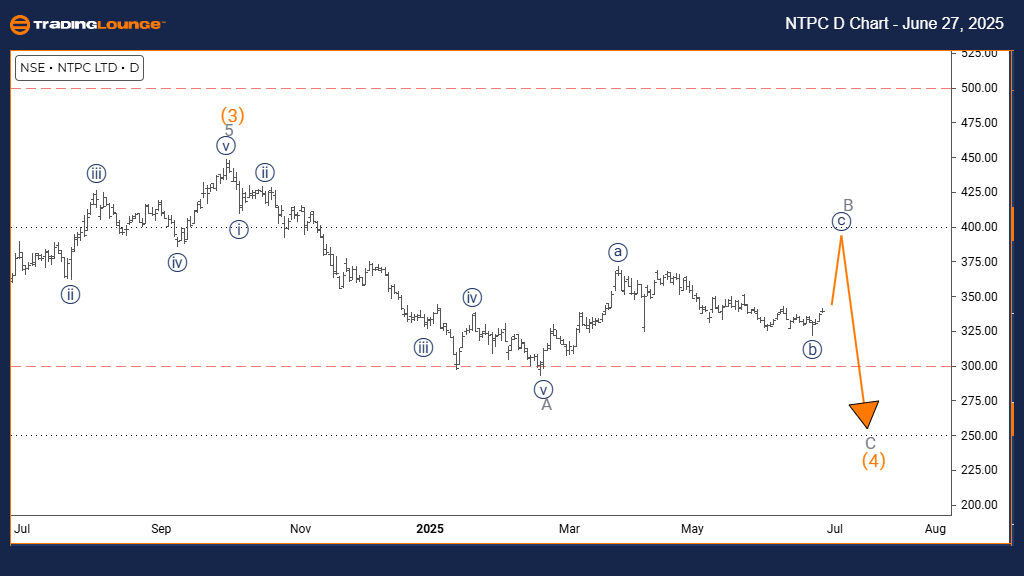
NTPC Elliott Wave technical analysis
Function: Counter Trend.
Mode: Impulsive.
Structure: Navy Blue Wave C.
Position: Gray Wave B.
Direction next lower degrees: Gray Wave C.
Details: Navy Blue Wave B appears complete, and Navy Blue Wave C is now developing.
The daily chart analysis for NTPC using Elliott Wave principles identifies a counter-trend movement. Price action is currently in an impulsive phase, signaling a sharp move against the dominant trend. This active wave is labeled as Navy Blue Wave C and forms part of the corrective structure inside Gray Wave B. This positioning indicates that the current counter-trend is nearing its final stage.
According to the wave analysis, Navy Blue Wave B has likely ended, giving way to Navy Blue Wave C. This wave usually marks the end of the counter-trend pattern and often carries strong momentum in the direction opposite to the main trend. After this wave finishes, Gray Wave C is expected to emerge at the lower degree.
The technical outlook for NTPC now suggests that it is in the final segment of the counter-trend move. With Navy Blue Wave C taking shape, traders can expect high volatility. While this impulsive move points to selling pressure, it's also important to watch for signs of reversal, as this C wave signals the potential conclusion of the broade
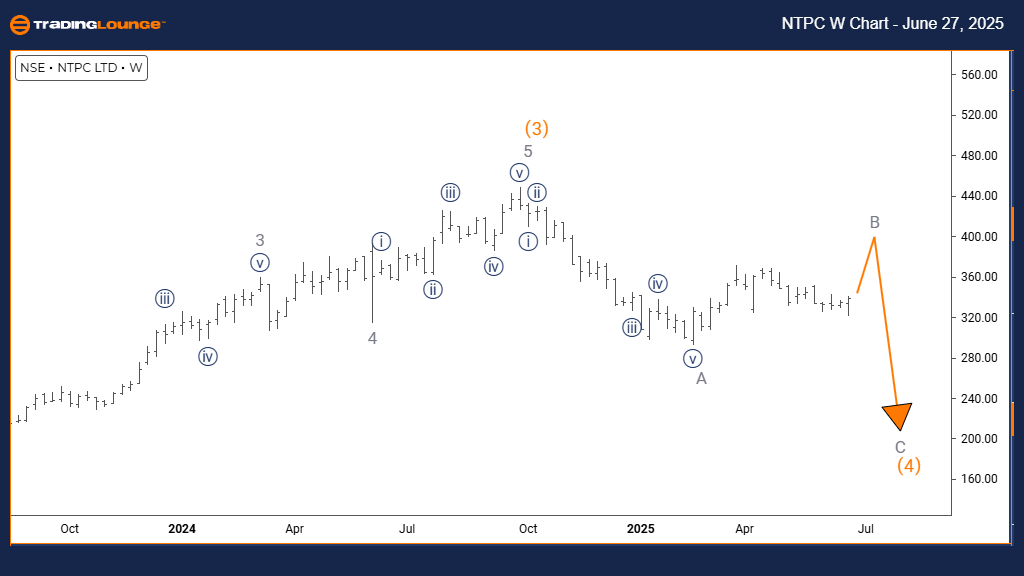
NTPC Elliott Wave technical analysis
Function: Counter Trend.
Mode: Corrective.
Structure: Gray Wave B.
Position: Orange Wave 4.
Direction next lower degrees: Gray Wave C.
Details: Gray Wave A seems completed; now, Gray Wave B is unfolding.
The weekly Elliott Wave analysis for NTPC highlights a counter-trend situation. Price action is in a corrective phase, reflecting a temporary reversal within a larger trend. The current structure places Gray Wave B inside the broader Orange Wave 4, indicating that the stock is undergoing a standard pullback before likely resuming its primary direction.
This analysis confirms that Gray Wave A has ended, giving rise to Gray Wave B. This ongoing wave typically corrects some of the movement from Gray Wave A. The expected next stage is Gray Wave C, which would develop once Gray Wave B is complete, potentially signaling a return to the prevailing trend.
NTPC's current setup points to ongoing activity in Gray Wave B following the end of Gray Wave A. This corrective sequence suggests possible sideways trading or slight declines. The position within Orange Wave 4 reinforces that this is part of an extended corrective pattern.
Traders should carefully observe Gray Wave B's progression for signs of completion. Once confirmed, Gray Wave C may start, indicating a renewed directional push in NTPC's price action. This setup represents a temporary consolidation phase before a new trend movement.
NTPC Elliott Wave technical analysis [Video]
Author

Peter Mathers
TradingLounge
Peter Mathers started actively trading in 1982. He began his career at Hoei and Shoin, a Japanese futures trading company.


