|

Nikkei ($NKD_F) should find extreme in wave 4 pullback soon [Video]

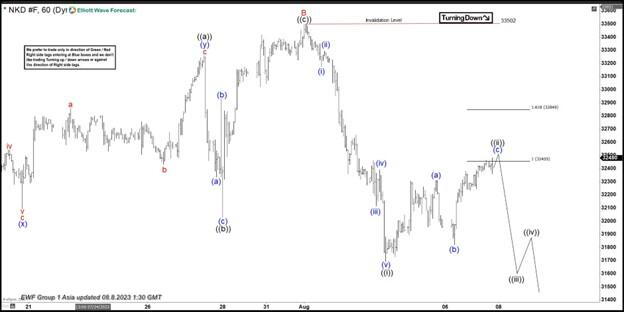
The Short term view in Nikkei futures ticket symbol: $NKD_F suggests that the index is doing a bigger pullback in wave (4) to correct the cycle from the 03 January 2023 low. The index is expected to find the extreme in the pullback soon. Before it can start the next leg higher or it does a 3-wave reaction higher at least. So far the pullback from the peak is unfolding as Elliott wave zigzag correction where wave A ended at 31800 low. Up from there, wave B bounce unfolded in a lesser degree flat correction with wave ((a)) completed at 33260 high. Wave ((b)) ended at 32030 low and then wave ((c)) ended in a lesser degree 5 waves at 33502 high thus completing wave B.

Down from there, the index made a new low below the previous wave A low. And confirmed the next extension in the C leg lower. Whereas the wave ((i)) ended at 31690 low in a lesser degree 5 waves impulse sequence. Above from there, the index is doing a bounce in wave ((ii)) in a lesser degree zigzag structure. Where small wave (a) ended at 32310. Wave (b) ended at 31820 and wave (c) should end between 32455- 32849 100%-161.8% Fibonacci extension area of (a)-(b). From there, the index is expected to resume the decline for a push towards 31274- 30748 bigger extreme area before it could resume higher again or ends up doing a 3-wave bounce minimum. Near-term, as far as bounces fail below 33502 high expect index to extend in C leg lower.

Nikkei 1 hour Elliott Wave chart from 8.08.2023
Nikkei Elliott Wave video

Author

Elliott Wave Forecast Team

Elliott Wave Forecast Team

ElliottWave-Forecast.com

More from Elliott Wave Forecast Team
Share:

Editor's Picks

GBP/USD treads water around 1.3500

GBP/USD keeps gyrating around the 1.3500 region amid humble gains on Thursday. In the meantime, Cable’s irresolute price action comes as investors continue to assess mixed UK data, poor US results as well as the persistent uncertainty surrounding the US-Iran conflict.

EUR/USD picks up pace; revisits 1.1530

EUR/USD trades with decent gains above the 1.1500 yardstick on Thursday. Persistent uncertainty in the Middle East fuels risk aversion, limiting the US Dollar’s downside potential. Earlier in the day, both US Producer Prices and weekly Claims missed market consensus, adding to the buck’s soft tone.

Gold meets resistance around $4,450

Gold extends its intraday pullback on Thursday, retesting the $4,370 zone per troy ounce and fading Wednesday’s uptick. Meanwhile, the precious metal continues to monitor developments from the Middle East as well as bets surrounding the potential Fed’s rate path.

Crypto Today: Bitcoin, Ethereum, XRP remain sluggish amid mixed ETF flows

The cryptocurrency market continues to trade sideways on Thursday, with Bitcoin struggling to reclaim the $64,000 level. Ethereum is attempting to build momentum near the key $1,900 resistance, while Ripple maintains support above $1.00, yet upward movement remains limited.

Week ahead – Summer lull could be tested by geopolitics and central bank expectations

US dollar stabilizes as September Fed hike bets remain subdued. Market volatility stays low, but thin liquidity could amplify movements. Key UK data could challenge pound strength; euro craves bullish catalysts.

Why is Crude Oil priced for a reopening the ships haven't made?
Fourteen vessels crossed the Strait of Hormuz on Tuesday. Before the war, the count ran near 120 a day. In the sessions since the waterway was publicly declared open, Brent has drifted back to $87 and West Texas Intermediate (WTI) to $81, both a little lower again on Wednesday, with daily momentum on each unwound from the top of its range in late July to the low twenties now.