Nifty 50 Index Elliott Wave technical analysis [Video]
![Nifty 50 Index Elliott Wave technical analysis [Video]](https://editorial.fxsstatic.com/images/i/stock-01.jpg)
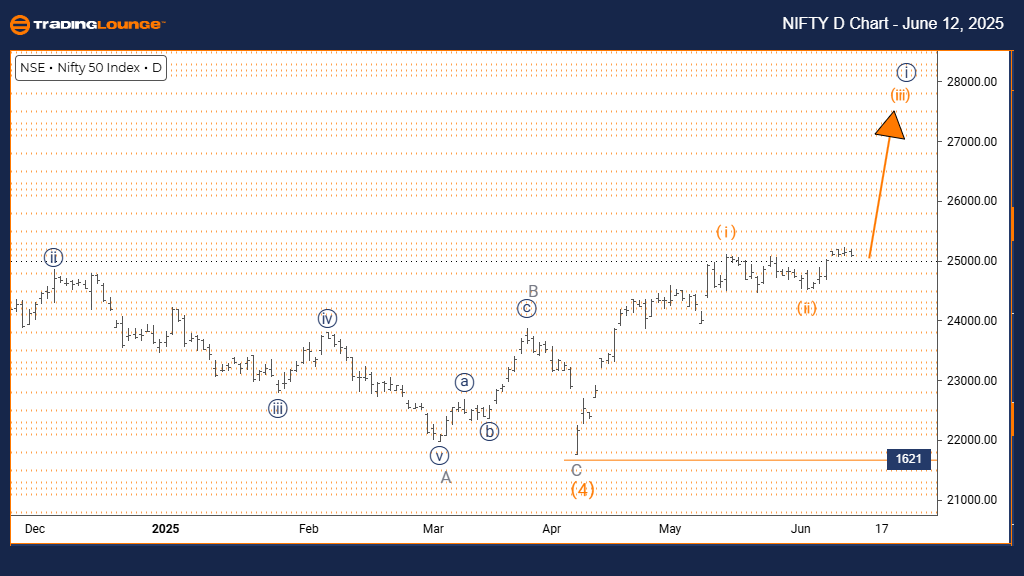
Nifty 50 Index Elliott Wave analysis – Day chart
Function: Bullish Trend.
Mode: Impulsive.
Structure: Orange Wave 3.
Position: Navy Blue Wave 1.
Direction next lower degrees: Orange Wave 4.
Details: Orange Wave 2 appears complete; Orange Wave 3 is currently unfolding.
Wave cancel invalidation level: 1621.
The Elliott Wave analysis for the NIFTY 50 INDEX daily chart indicates a bullish trend. Price action is in impulsive mode, showing strong upward momentum. The current wave structure is identified as Orange Wave 3, which is part of a broader wave configuration labeled as Navy Blue Wave 1. This setup places the index in a significant advancing phase within a larger bullish cycle.
Orange Wave 2 seems to have finished its corrective movement, transitioning into the impulsive Orange Wave 3. Typically, this wave delivers the most powerful price movement in an Elliott sequence. The next expected phase at lower degrees is Orange Wave 4, a corrective pullback that generally follows the completion of Wave 3, before the uptrend continues.
A key technical level to watch is the wave invalidation point at 1621. If the index falls below this level, it would invalidate the current wave structure, requiring a reassessment of the bullish outlook. Until such a breach occurs, the existing wave analysis supports ongoing upward momentum.
The current chart pattern suggests that the NIFTY 50 INDEX is poised for extended gains. Orange Wave 3 is active, and the prior correction (Orange Wave 2) appears complete. The impulsive nature of Wave 3 signals strong market interest and suggests a likelihood of continued bullish movement.
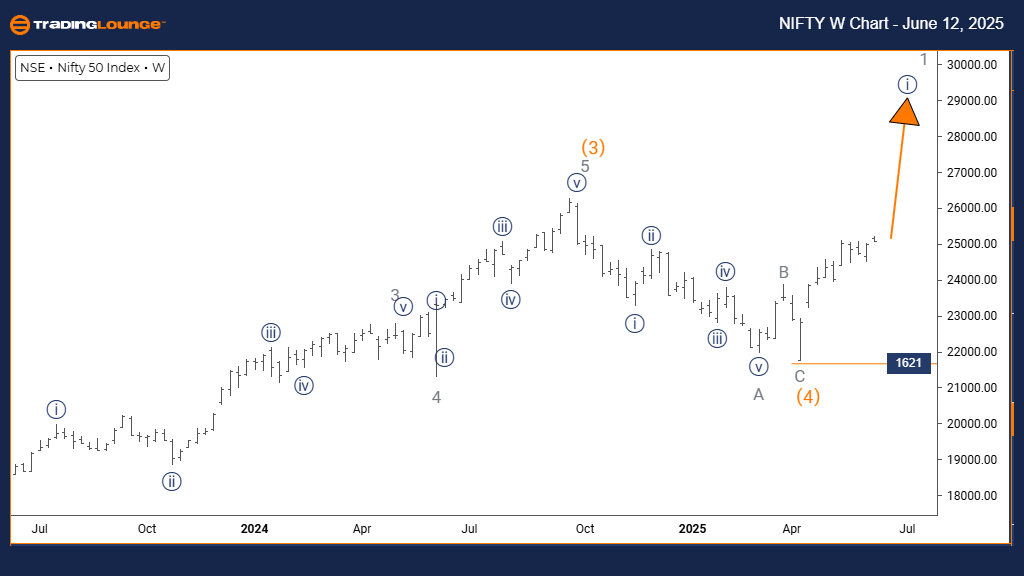
Nifty 50 Index Elliott Wave analysis – Weekly chart
Function: Bullish Trend.
Mode: Impulsive.
Structure: Navy Blue Wave 1.
Position: Gray Wave 1.
Direction next lower degrees: Navy Blue Wave 2.
Details: Orange Wave 4 appears to be complete; now Navy Blue Wave 1 of Gray Wave 1 is active.
Wave cancel invalidation level: 1621.
The Elliott Wave analysis for the NIFTY 50 INDEX weekly chart shows a bullish trend. Price action is in impulsive mode, indicating strong upward momentum. The wave structure is currently labeled as Navy Blue Wave 1, forming part of a larger sequence identified as Gray Wave 1. This setup suggests that the index is in the early phase of a long-term bullish move.
The analysis shows that Orange Wave 4 has likely completed its corrective phase, transitioning into Navy Blue Wave 1 of Gray Wave 1. This move typically marks the start of a new impulsive trend. The next expected development at a lower degree is Navy Blue Wave 2, which would generally represent a pullback before the uptrend resumes.
A key technical level to watch is 1621, the invalidation point. If the index moves below this level, the current wave scenario would be invalid, requiring a reevaluation of the bullish outlook. Until this level is breached, the chart suggests continued upward momentum.
The current technical formation supports a potential for ongoing bullish movement. With Orange Wave 4 completed and Navy Blue Wave 1 in progress, the setup implies strong market interest and an expectation of further price gains in the medium term.
NIFTY 50 Index Elliott Wave technical analysis [Video]
Author

Peter Mathers
TradingLounge
Peter Mathers started actively trading in 1982. He began his career at Hoei and Shoin, a Japanese futures trading company.


