Nifty 50 — Has the Indian stock market spent two years making a major top?

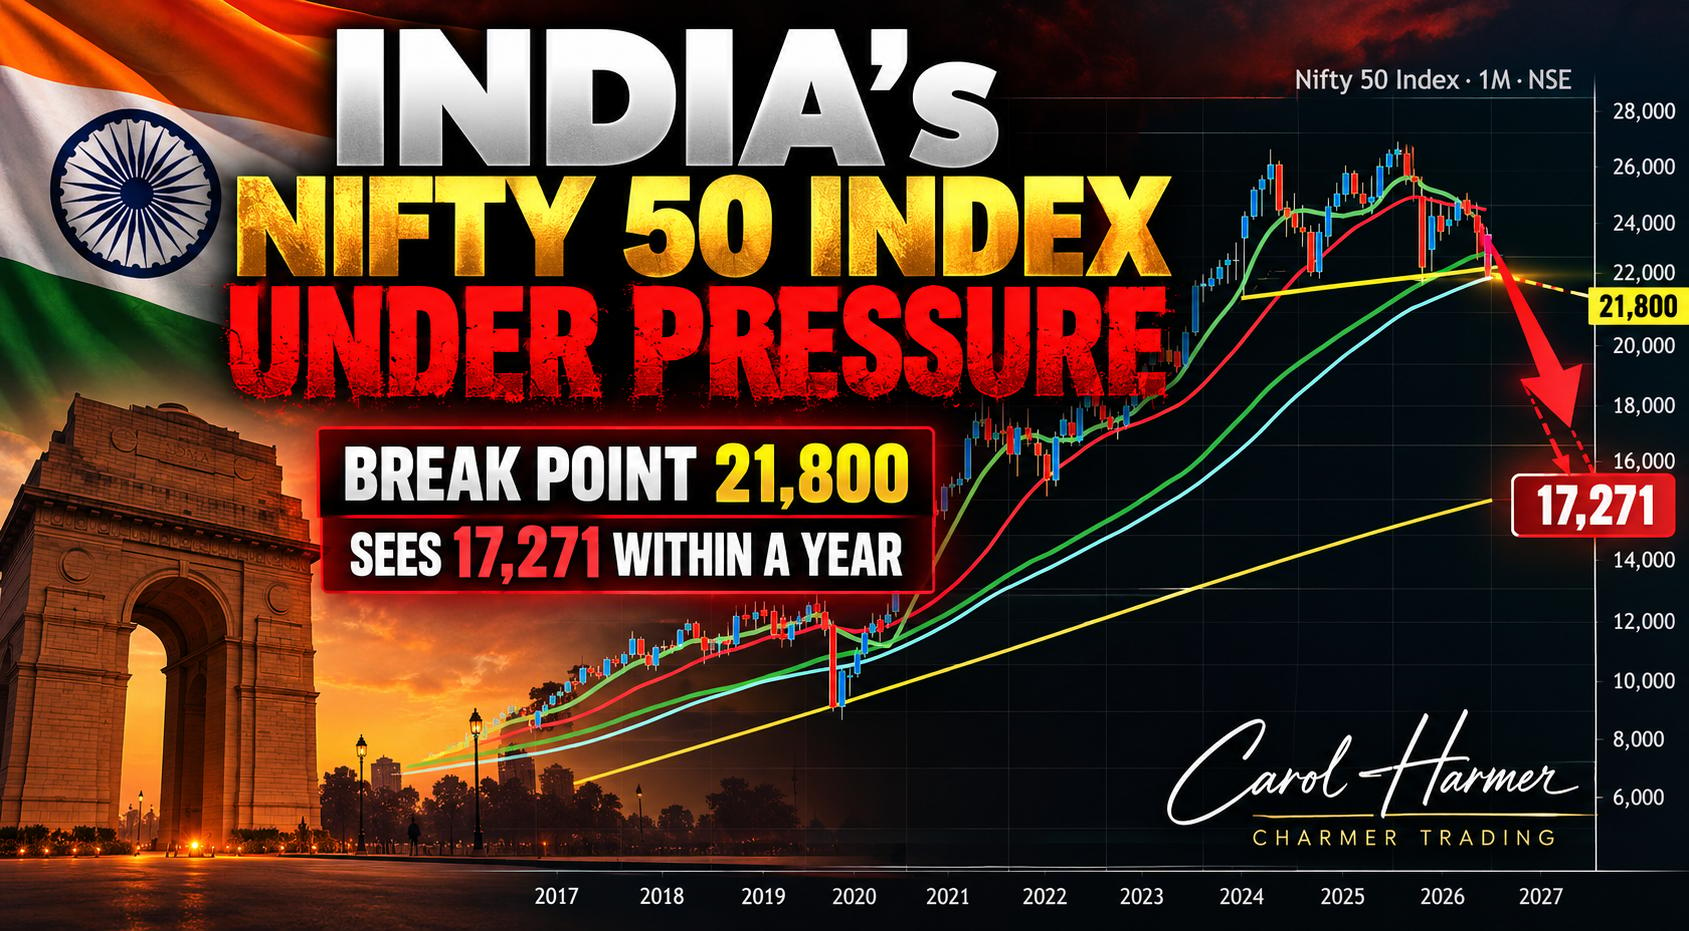
Nifty 50 — Has the Indian stock market spent two years making a major top? One of my students pointed the NIFTY 50 out to me yesterday. To be fair, it is the first time I have seriously looked at the Indian stock market — but the moment I pulled up the monthly chart, something stood out. This market appears to have spent nearly 2 years building a major top.
This is why I tell traders not to live solely on daily charts. When identifying a major top or bottom, the monthly chart gives you a completely different perspective, stripping away the day-to-day noise and revealing the bigger structure. The level I am watching 21,800..For me, this is the major break point. We have important long-term technical support in this area:22,400 — approximate trendline break.21,800 — where I want to see the market establish a genuine break. This also brings us into the region of the long-term 23.6% Fibonacci retracement, measured from the major bull move beginning in 2020. I'm deliberately giving the market some room because markets overshoot. Stops are triggered, algorithms kick in and traders react to the days range rather than looking at the bigger picture.
Volume is also telling us something. Markets forming long-term tops often display certain characteristics. One is decreasing volume. This can indicate bulls gradually distributing/offloading positions rather than aggressively adding to them. And weve seen that here. Another characteristic of major tops is that the move down can be considerably faster than the time taken to build the top. Markets can spend years climbing the stairs......and then take the lift down. So where could NIFTY 50 go? Using the old, tried-and-tested method of measuring the pattern, I get a downside target of: 17,271. That doesnt mean were going there in a straight line. There is significant support first, particularly around the long-term 38.2% Fibonacci level at 19,167. But even reaching that area would represent a substantial move lower. One important warning. With a pattern this obvious, I would be wary of the first break of 21,800. That first move could simply trigger stops and attract breakout sellers before reversing. Let it break. Let it settle. Then watch the reaction.
For me, a second confirmed break of 21,800 would be far more interesting. There is another old technical-analysis principle worth remembering. If a pattern has taken approximately two years to form, I would expect the measured target — if confirmed — to be achievable in roughly half that time. That puts 17,271 potentially within a year of confirmation. This is now firmly on my watchlist. Because stock markets have an uncanny habit...When one starts falling, eventually the others tend to notice.NIFTY 50: 21,800 is the line in the sand.
Author

Carol Harmer
Charmer Trading
Carol Harmer has over 39 years experience of analysing and trading the world's markets and is undoubtedly one of the most respected technical trader in the world today.