New Zealand Dollar holds immediate support near 0.5625, outlook remains uncertain
- NZD/USD rises to near 0.5645 amid a slight correction in the US Dollar Index.
- Market experts see Fed’s hawkish stance to support the US Dollar for longer.
- China’s RatingDog Manufacturing PMI data for September arrives at 52.1, beats 51.6 estimates.

The New Zealand Dollar (NZD) is 0.11% higher at around 0.5645 against the US Dollar (USD) during the Asian trading session on Wednesday. The Kiwi pair gains after discovering cushion near 0.5625 on Tuesday, following a vertical decline in the past few weeks. The pair attracts slight bids as the US Dollar Index (DXY) corrects marginally after revisiting the two-month high at 101.64.
The outlook of the pair remains bearish as market experts see a prolong strength in the US Dollar due to hawkish Federal Reserve (Fed) interest rate expectations.
Dollar support reinforced as Fed path and energy prices align
Analysts at MUFG/BTMU highlight that, after delivering their first hike this month, the US rate market now expects the Fed to deliver "almost another 100bps of rate hikes in the year ahead," a trajectory that is "reinforcing support for the US Dollar from the positive terms of trade shock for the US economy from higher energy prices." In their view, this combination of tighter Fed policy expectations and elevated energy costs means "the current backdrop is supportive of the US Dollar remaining stronger for longer."
Fed board members have also kept the door open for more interest rate hikes this year. On Tuesday, New York Fed Governor John Williams said that “one further hike likely this year” if inflation remains entrenched. However, Williams clarified that there is “no need for urgency after September rate hike and more data will help the fed decide what’s next for rate policy.”
Meanwhile, China’s RatingDog Manufacturing Purchasing Managers’ Index (PMI) data for September has come in stronger-than-expected. The data arrives at 52.1, higher than 51.6 estimates and the previous reading of 51.5.
Theoretically, the New Zealand Dollar reacts positively to China’s Manufacturing PMI data, given the high reliance of the New Zealand (NZ) economy on its exports to Beijing.
NZD/USD Technical Analysis
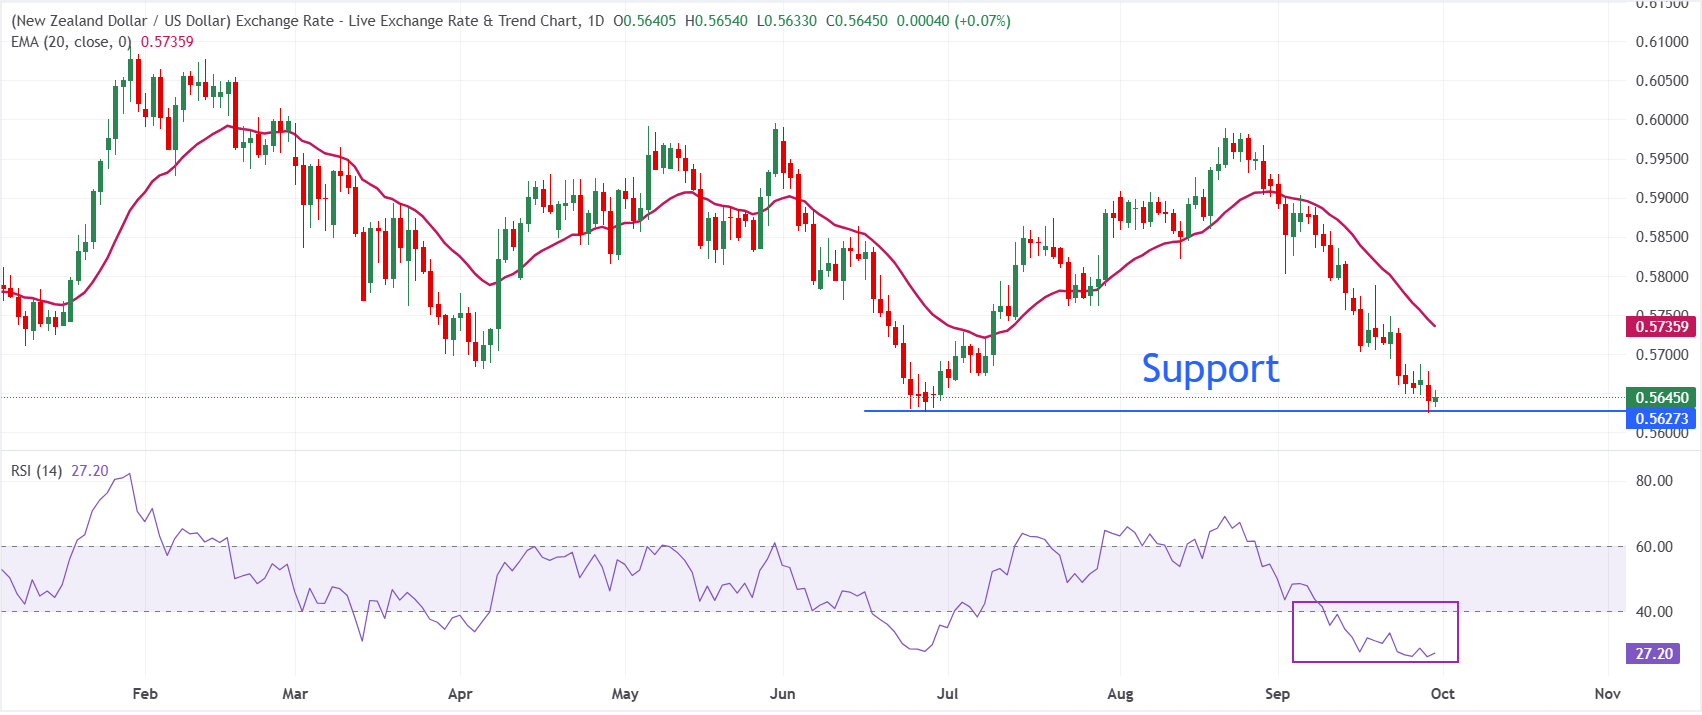
In the daily chart, NZD/USD trades at 0.5645, keeping a bearish near-term tone as spot holds beneath the 20-day exponential moving average (EMA) at 0.5736. The pair remains pressed lower by this overhead dynamic barrier, while the Relative Strength Index (RSI) at 27 stays in oversold territory, hinting that downside momentum is strong but approaching exhaustion.
On the topside, initial resistance is located at the 20-day EMA around 0.5736, which would need to be reclaimed to ease immediate selling pressure and allow for a corrective bounce. As long as NZD/USD trades under this level, the broader technical picture favors further weakness, with any recovery attempts likely to struggle while price remains capped below the EMA.
(The technical analysis of this story was written with the help of an AI tool. Know more.)
Economic Indicator
RatingDog Manufacturing PMI
The RatingDog Manufacturing Purchasing Managers Index (PMI), released on a monthly basis by Caixin Insight Group and S&P Global, is a leading indicator gauging business activity in China’s manufacturing sector. The data is derived from surveys of senior executives at both private-sector and state-owned companies. Survey responses reflect the change, if any, in the current month compared to the previous month and can anticipate changing trends in official data series such as Gross Domestic Product (GDP), industrial production, employment and inflation.The index varies between 0 and 100, with levels of 50.0 signaling no change over the previous month. A reading above 50 indicates that the manufacturing economy is generally expanding, a bullish sign for the Renminbi (CNY). Meanwhile, a reading below 50 signals that activity among goods producers is generally declining, which is seen as bearish for CNY.
Read more.Last release: Wed Sep 30, 2026 01:45
Frequency: Monthly
Actual: 52.1
Consensus: 51.6
Previous: 51.5
Source: IHS Markit
Author

Sagar Dua
FXStreet
Sagar Dua is associated with the financial markets from his college days. Along with pursuing post-graduation in Commerce in 2014, he started his markets training with chart analysis.