Netflix (NFLX) Earnings: NFLX holds 200 day MA support, MACD & DMI flash sell signals
- Netflix (NFLX) opens 7% lower on Wednesday after results.
- NFLX EPS and revenue beat but subscriber growth stalls.
- NFLX buying back shares is a questionable use of funds.
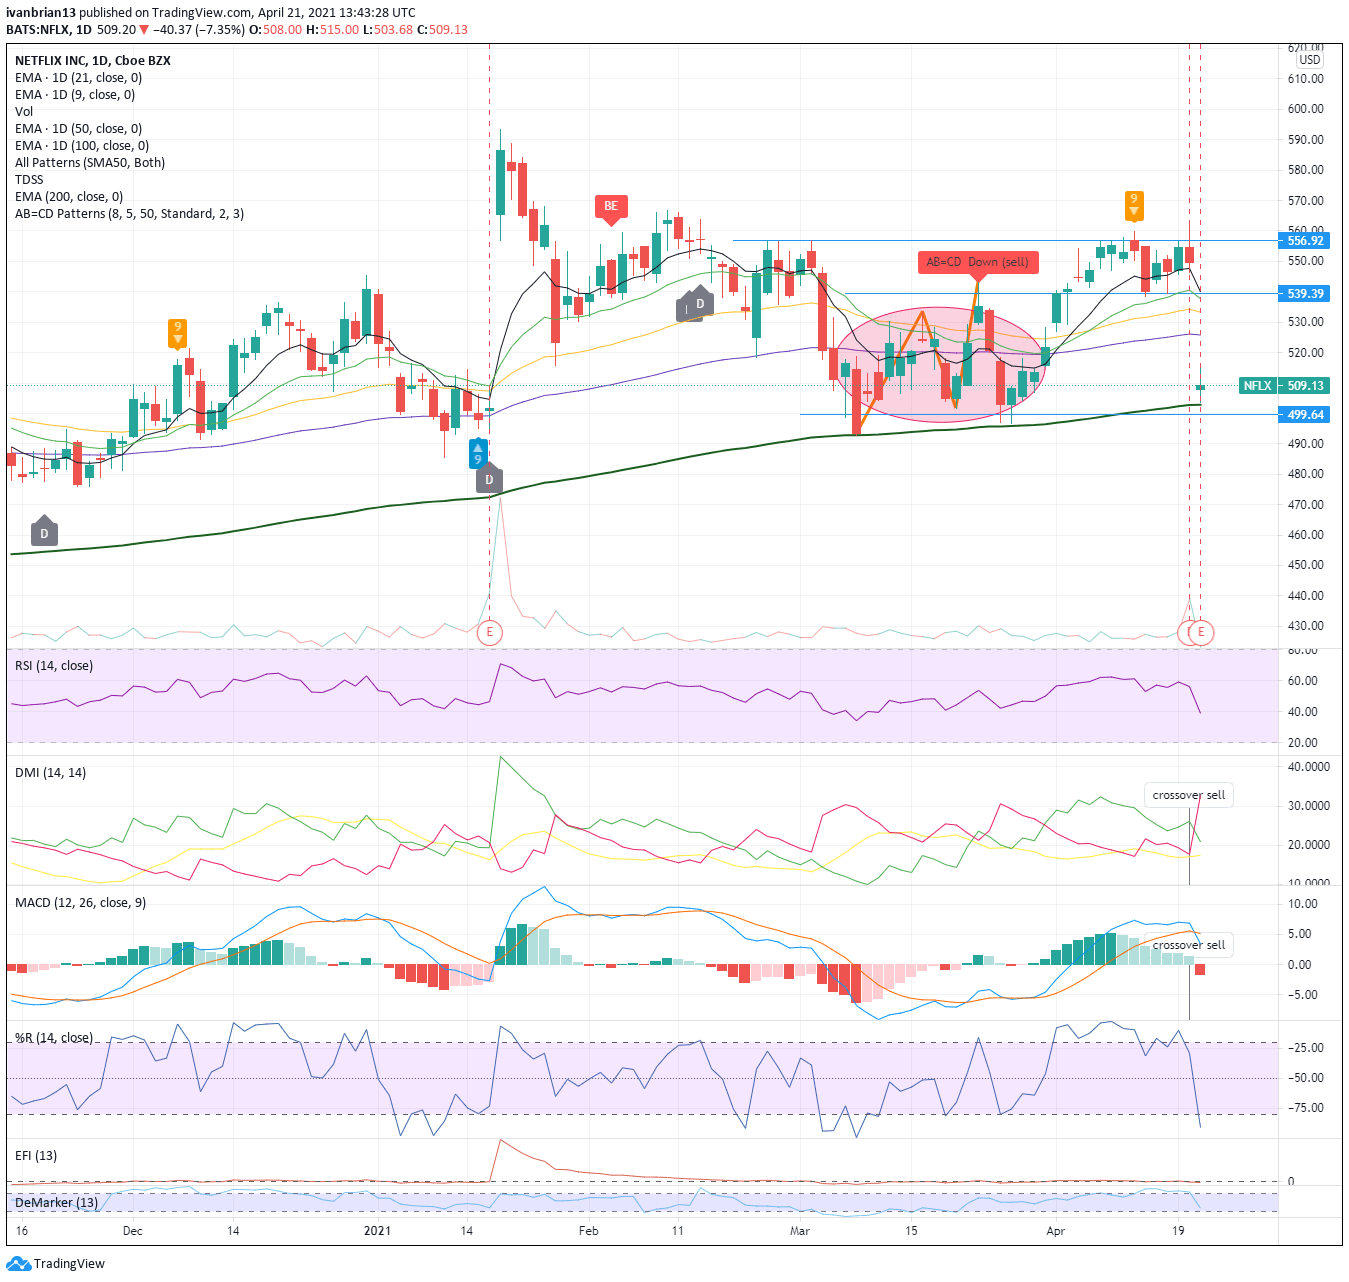
Update: Netflix shares open 7% lower on Wednesday. Critically the 200-day moving average support is held but for how long? The MACD has flashed a sell signal as has the Direction movement Index (DMI). The DeMark 9 sell signal is also still in place and has proven prophetic. Long-term traders may wish to sell NFLX on a break of the 200-day moving average. Short-term traders may look to buy a bounce from the 200 day MA but should note the big picture is now bearish.
Netflix reported earnings after the close of the market on Tuesday. Yet again, the top-line number proved strong with earnings per share coming in at $3.75 versus the forecast of $2.96. Revenue came in at $7.163 billion, more or less in line with the forecast for $7.13 billion. Netflix (NFLX) shares dropped as much as 10% in after-hours trading on Tuesday, post the release.
Stay up to speed with hot stocks' news!
Why, you say? Well, the market decided to ignore the stellar results and focus instead on subscriber numbers. Here is where the market found what it was looking for, a reason to sell. Let's be clear, these are good numbers. The market finds reason to do what it wants to do and this sharp fall is evidence of the overall fear in the market right now that we have priced in all the reopening optimism.
Netflix (NFLX) stock forecast
Netflix crushed EPS, it beat on revenue. Netflix said Q2 EPS will be around $3.16, analysts had pencilled in $2.68. It forecast Q2 revenue to be $7.3 billion while analysts have forecast $7.39 billion.
Netflix said subscriber numbers were 208 million while analysts had forecast subscribers to reach 210 million. The problem was in the slowing of subscriber growth. Netflix added four million new subscribers in this quarter, versus 16 million in Q1 2020. The market had anticipated a slowing in subscriber growth, with analysts forecasting it to drop to six million in Q1. Still, four million is a 33% miss.
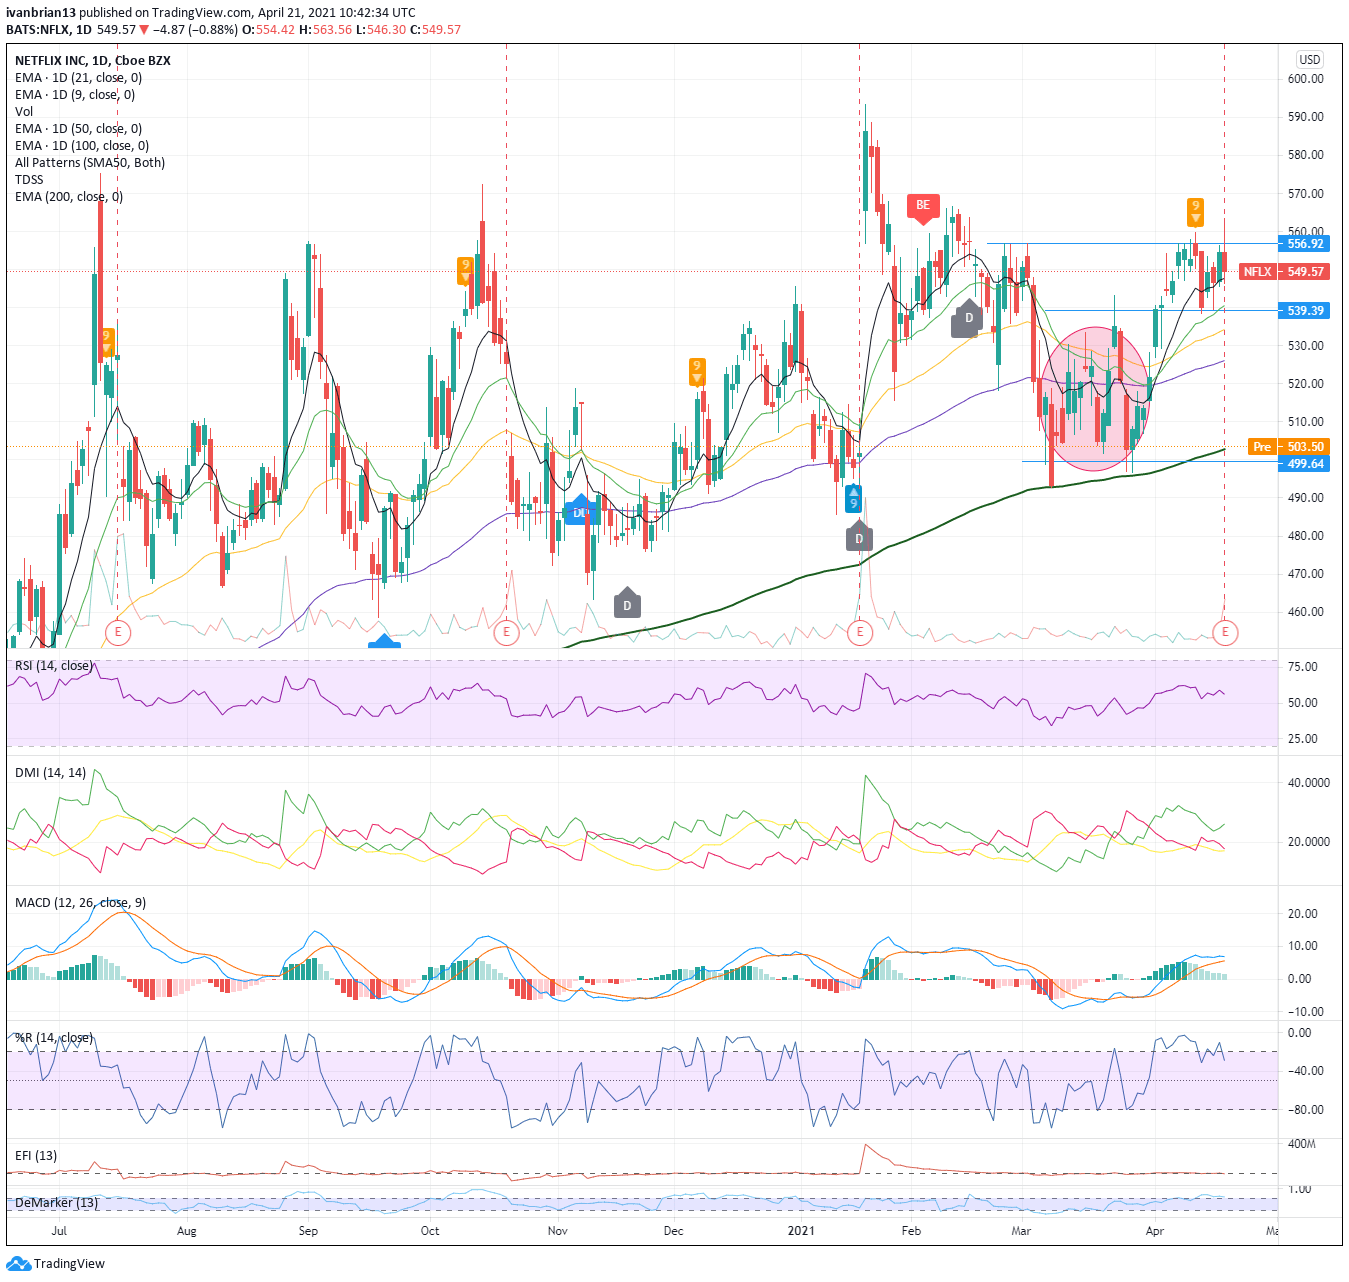
Netflix shares immediately dumped in the aftermarket trading, dropping 10%. Currently, Netflix shares are trading just above $500, at $503. NFLX shares had finished Tuesday's regular session at $549.
Netflix (NFLX) stock chart
On the chart, we can see we have entered a new range identified by the bubble. NFLX has smashed through all moving average supports. It gets interesting as the 200-day moving average is set just around current levels. This is the key level for future direction. The indicators have not yet caught up with the price move but are likely to form bearish crossovers. NFLX has successfully used the 200-day MA to bounce from the previous sell-offs on March 8 and 26. The more support is tested the more likely it is to break.
We will update just after the regular market opens to give a clearer picture as the indicators have not been updated to account for the after and pre-market fall. For now, the battle of 200 days is approaching.
Netflix buybacks
One other interesting note is that Netflix announced a $5 billion buyback. Buybacks can be positive or negative, most view them as positive as they reverse dilute your shareholding. But, buybacks should only be undertaken by companies when they can find no other alternative use for cash. Netflix is essentially saying we can find nothing else to invest this $5 billion in to earn a higher return. This is despite the company planning content spend to arrest subscriber growth slowing. The only other time a buyback can be taken as a positive is when the market has consistently undervalued a company. This is certainly not the case for NFLX. Netflix says it expects to maintain $10-15 billion in debt. So, essentially, Netflix is using debt to fund buybacks instead of just repaying the debt. Overall, this is a very odd decision.
The author has no position in any stock mentioned in this article and no business relationship with any company mentioned. The author has not received compensation for writing this article, other than from FXStreet.
This article is for information purposes only. The author and FXStreet are not registered investment advisors and nothing in this article is intended to be investment advice. It is important to perform your own research before making any investment and take independent advice from a registered investment advisor.
FXStreet and the author do not provide personalized recommendations. The author makes no representations as to accuracy, completeness, or the suitability of this information. FXStreet and the author will not be liable for any errors, omissions or any losses, injuries or damages arising from this information and its display or use. The author will not be held responsible for information that is found at the end of links posted on this page.
Errors and omissions excepted.
Premium
You have reached your limit of 3 free articles for this month.
Start your subscription and get access to all our original articles.
Author

Ivan Brian
FXStreet
Ivan Brian started his career with AIB Bank in corporate finance and then worked for seven years at Baxter. He started as a macro analyst before becoming Head of Research and then CFO.


