|

Netflix (NFLX) bearish Elliott wave sequence targets $50 [Video]

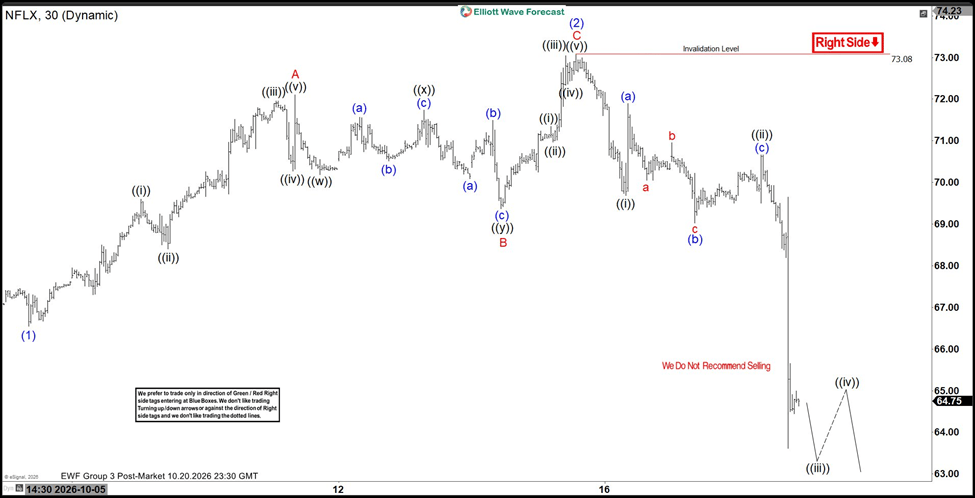
Netflix (NFLX) continues to exhibit an incomplete bearish sequence from the June 30, 2025 high, and the structure still calls for additional downside. The broader decline maintains a potential target at the 100% Fibonacci extension near $50, which remains the primary extreme area for the current cycle. In the short term, the sequence from the September 3, 2026 high is progressing as an impulse. Within this decline, wave (1) ended at $66.54, and the subsequent rally in wave (2) concluded at $73.08, as reflected in the thirty‑minute chart referenced earlier.

The stock has since broken below the prior wave (1) low, which confirms that the next leg lower is underway. From the wave (2) peak, wave ((i)) finished at $69.69, followed by a rally in wave ((ii)) that ended at $70.66 in a running flat formation. The current expectation is for the stock to continue declining to complete wave ((iii)). After wave ((iii)) ends, a corrective rally in wave ((iv)) should develop before the stock turns lower again in wave ((v)) to extend the broader bearish structure.

Netflix (NFLX) 30 minute Elliott Wave chart
Chart

As long as the pivot at $73.08 remains intact, any near‑term rally is expected to fail and give way to further weakness. This view aligns the short‑term impulse with the larger bearish sequence, reinforcing the prospect of continued downside pressure as the market works toward the projected extreme area.

NFLX Elliott Wave video
Youtube preview

Author

Elliott Wave Forecast Team

Elliott Wave Forecast Team

ElliottWave-Forecast.com

More from Elliott Wave Forecast Team
Share:

Editor's Picks

AUD/USD sits at three-week highs above 0.7000 on hawkish RBA-speak

AUD/USD holds a positive bias for the fourth straight day, trading above 0.7000 in the Asian session on Wednesday and at three-week highs. RBA Deputy Governor Andrew Hauser's hawkish remarks and inflation concerns underpin the pair. However, the upside appears capped as the US Dollar attracts some buyers amid looming US-Iran uncertainty.

USD/JPY remains confined in a familiar range below 158.50

USD/JPY sees some dip-buying in the Asian session on Wednesday, though it remains confined within a multi-week range near 158.50 as the uncertainty over the timing of the next BoJ rate hike keeps Japanese Yen bulls on the defensive. Meanwhile, hawkish Fed expectations, bolstered by inflation risks stemming from volatile oil prices, underpin the US Dollar. However, looming intervention fears could limit JPY losses and cap the currency pair.

Gold appears slightly bid above $4,100

Gold prices manage to reverse three consecutive daily declines, trading just above the $4,100 per troy ounce on Wednesday. The yellow metal’s recovery comes amid a humble advance in the US Dollar, mixed US Treasury yields across the board and a widespread cautious tone from the US-Iran front.

Bitcoin eyes a break above $85,000 as institutional demand returns

Bitcoin edges higher above $83,000, extending its rebound from the 50-day EMA near $80,786. US-listed BTC spot ETFs recorded over $23 million in net inflows on Tuesday, following Monday's $526 million, signaling a return of institutional demand.

What November 3 means for the Fed's rate path and the US Dollar

The USD faces a decisive period ahead of the November 3 midterm elections. While markets anticipate another interest rate increase from the Fed in December, the battle for control of Congress could reshape fiscal policy expectations and, indirectly, the path of US monetary policy in 2027.

The US Dollar fell. Gold didn't rally. That tells you everything
Gold (XAU/USD) is struggling to capitalize on a weaker US Dollar (USD), after repeatedly failing to establish itself above the $4,200 level. The precious metal remains confined to a relatively narrow trading range despite a combination of developments that would normally support higher prices.