|

Natural Gas Price Analysis: XNG/USD looks all set to refresh multi-month low near $2.00

  • Natural fades the previous day’s corrective bounce off five-week low.
  • Sustained trading below two-week-old descending trend line favors bears.
  • Yearly low, early July 2020 top can prod XNG/USD bears before directing them to 61.8% Fibonacci Expansion.
  • Bulls need validation from a downward-sloping resistance line from late December 2022.

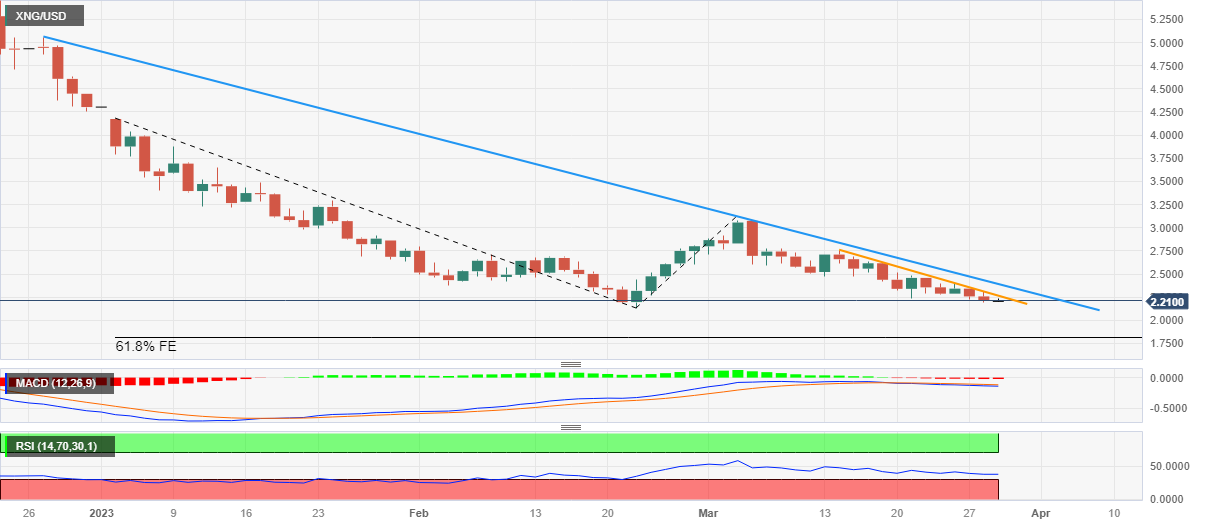
Natural Gas (XNG/USD) holds lower ground near $2.20 as bears poke the Year-To-Date (YTD) low marked in February. In doing so, the energy quote remains sluggish after declining in the last two consecutive days.

The XNG/USD bears cheer the sustained trading below a fortnight-long descending resistance line, around $2.27 by the press time, amid bearish MACD signals and an absence of oversold RSI (14).

As a result, the Natural Gas price appears well-set to slip beneath the yearly low of $2.13, which in turn highlights the $2.00 psychological magnet.

However, the early July 2020 high surrounding $1.97 and the 61.8% Fibonacci Expansion (FE) of its moves during early January-March 2023, around $1.80, could challenge the Natural Gas bears afterward, amid a likely oversold RSI line around then.

On the contrary, an upside break of the stated immediate resistance line, close to $2.27, isn’t an open invitation to the Natural Gas buyers as another downward-sloping trend line from the year’s start, near $2.40 at the latest, acts as an additional check for the XNG/USD bulls.

Should the quote manages to remain firmer past $2.40, the odds of witnessing a rally toward the mid-March high of $2.75 can’t be ruled out.

Natural Gas Price: Daily chart

Trend: Further downside expected

Author

Anil Panchal

Anil Panchal

FXStreet

Anil Panchal has nearly 15 years of experience in tracking financial markets. With a keen interest in macroeconomics, Anil aptly tracks global news/updates and stays well-informed about the global financial moves and their implications.

More from Anil Panchal
Share:

Editor's Picks

EUR/USD holds losses below 1.1650 on renewed USD uptick

EUR/USD is off the low but remains in the red below 1.1650 in European trading on Thursday. The pair faces headwinds from a renewed uptick in the US Dollar amid a negative shift in risk sentiment. Surging energy prices due to the Middle East war keep the bearish pressure intact on the Euro. The US Jobless Claims data are next of note. 

GBP/USD stays weak near 1.3350 amid UK stagflation risks

GBP/USD sticks to losses near 1.3350 in the European session on Thursday. The Pound Sterling loses ground amid fears that the United Kingdom economy could face stagflation risks due to higher energy prices, while the US Dollar attracts fresh havem demand ahead of the US Jobless Claims data. 

Gold climbs near $5,200 as Iran war fuels safe-haven demand

Gold price extends its gains for the second successive session on Thursday as traders seek safety amid the ongoing war in the Middle East. US and Israeli strikes across Iranian territory and widespread Iranian missile and drone retaliation across the Middle East, including attacks on regional targets and military sites, prolong the crisis and its impact.

Three reasons to be bearish on Bitcoin

Bitcoin is holding up well taking into account the uncertainty stemming from the Middle East. Despite this week’s rally, the long-term outlook remains bearish. Here are three reasons why I think the storm for the largest cryptocurrency isn't over yet.

FX alert: When Energy still writes the macro script the Dollar holds the pen

The market is quietly sliding back into the trade nobody wanted to own, but everyone now has to respect again. The no quick off-ramp trade. Yesterday’s bounce in risk assets already looks less like a turning point and more like a classic relief rally in a market that briefly inhaled before realizing the room was still on fire.

Cardano Price Analysis: Approaches key trendline amid bearish sentiment

Cardano (ADA) price is approaching its descending trendline around $0.28 at the time of writing, set to shape the next directional move. The derivatives metrics paint a bearish picture, with ADA’s Open Interest continuing to fall and short bets rising among traders.