NASDAQ trends down as US 30-year yield scales up to 2007 levels
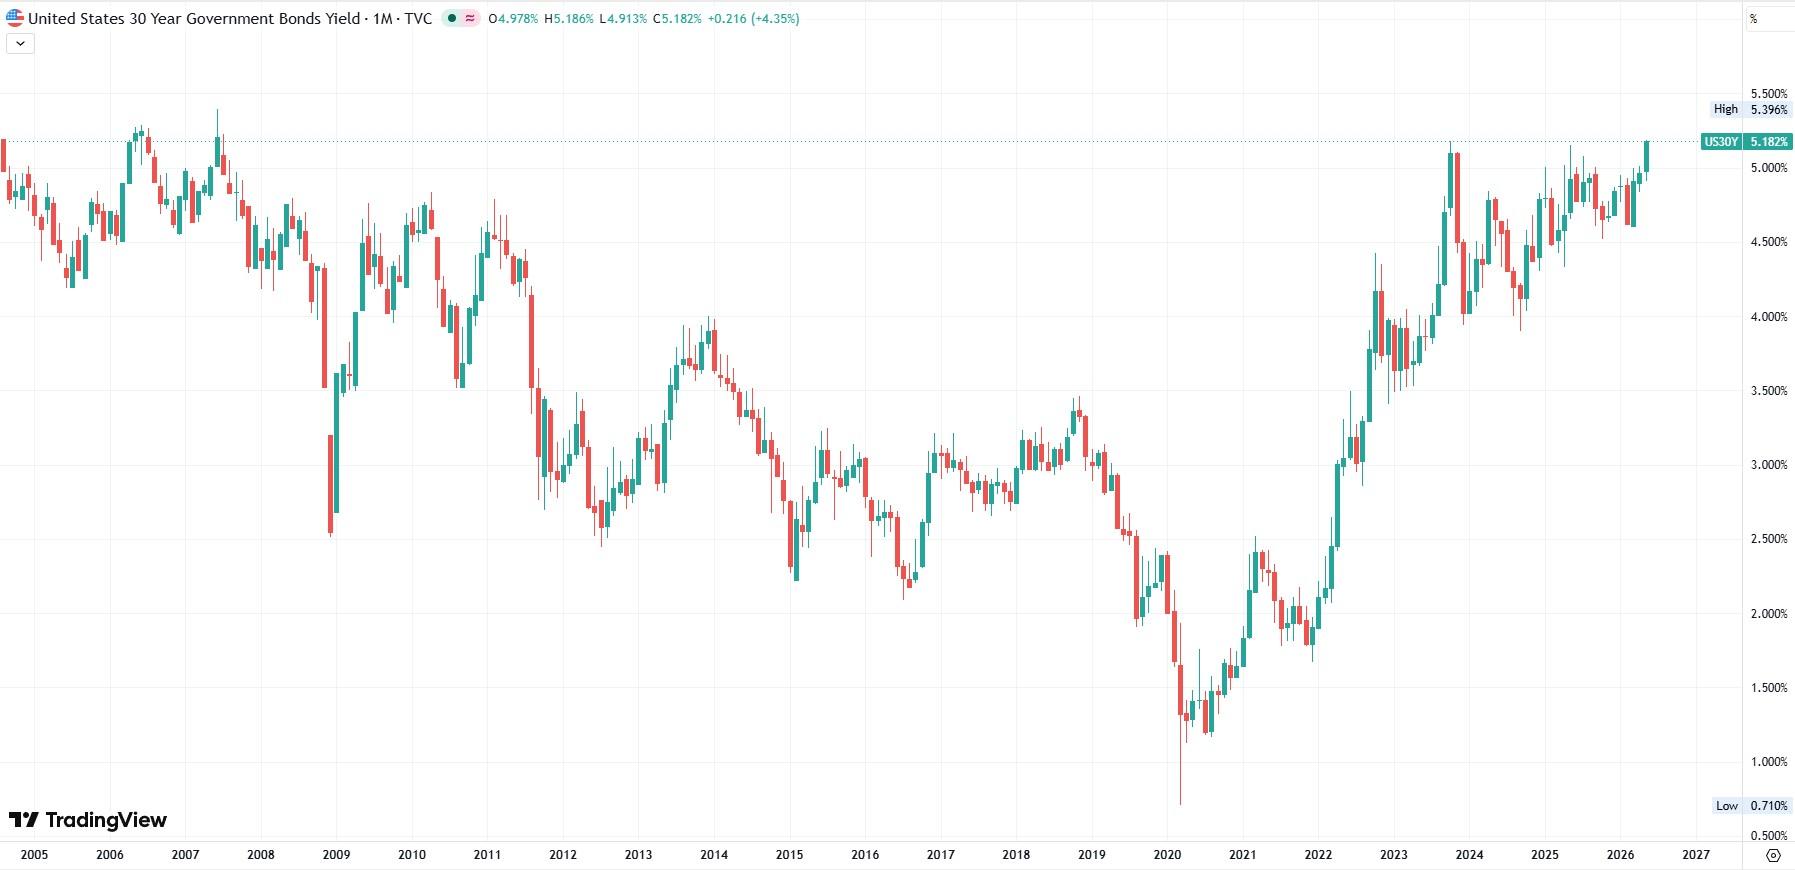
- US 30-year Treasury yields reach a 19-year high.
- NASDAQ 100 declines for the third straight day on Tuesday.
- Market looks ahead to Nvidia's Q1 earnings on Wednesday's post-market.
- NDX could shed 9% if it decides to move back to 50-day SMA.

The NASDAQ 100 (NDX) shed close to 1.4% on Tuesday morning as the US stock market continued to be weighed down by the highest long-term US Treasury yields in 19 years. Higher US bond yields, sparked by increasing inflation largely attributed to Iran's closure of the Strait of Hormuz, are a burden for the growth-focused stocks that litter the popular index.
The US 30-year Treasury yield climbed to 5.186% on Tuesday, its highest reading since July 2007 and higher than the 5.178% range high it witnessed in October 2023. The thought will be lost on no one that July 2007 is when the US economy entered into the recession that led to the Great Financial Crisis of 2008. However, 19 years ago, these Treasury yields took place in a long-term secular bear market for Treasury yields. This time they're happening during a period of rising interest rates.
The S&P 500 and Dow Jones Industrial Average (DJIA) also gave up half a percentage point or more in the morning trade.
NASDAQ 100 still positioned for Nvidia earnings beat
This is the third straight day that the NASDAQ 100 has shed weight, but the tech-heavy index is still positioned near all-time highs as the market gears up for Nvidia (NVDA) Q1 fiscal earnings print arriving late Wednesday.
Despite the euphoria surrounding Nvidia's AI-inflected revenue uplift, the NASDAQ 100 has notably fallen out of overbought levels on the Relative Strength Index (RSI). The NDX has been trading above the 70 level since mid-April.
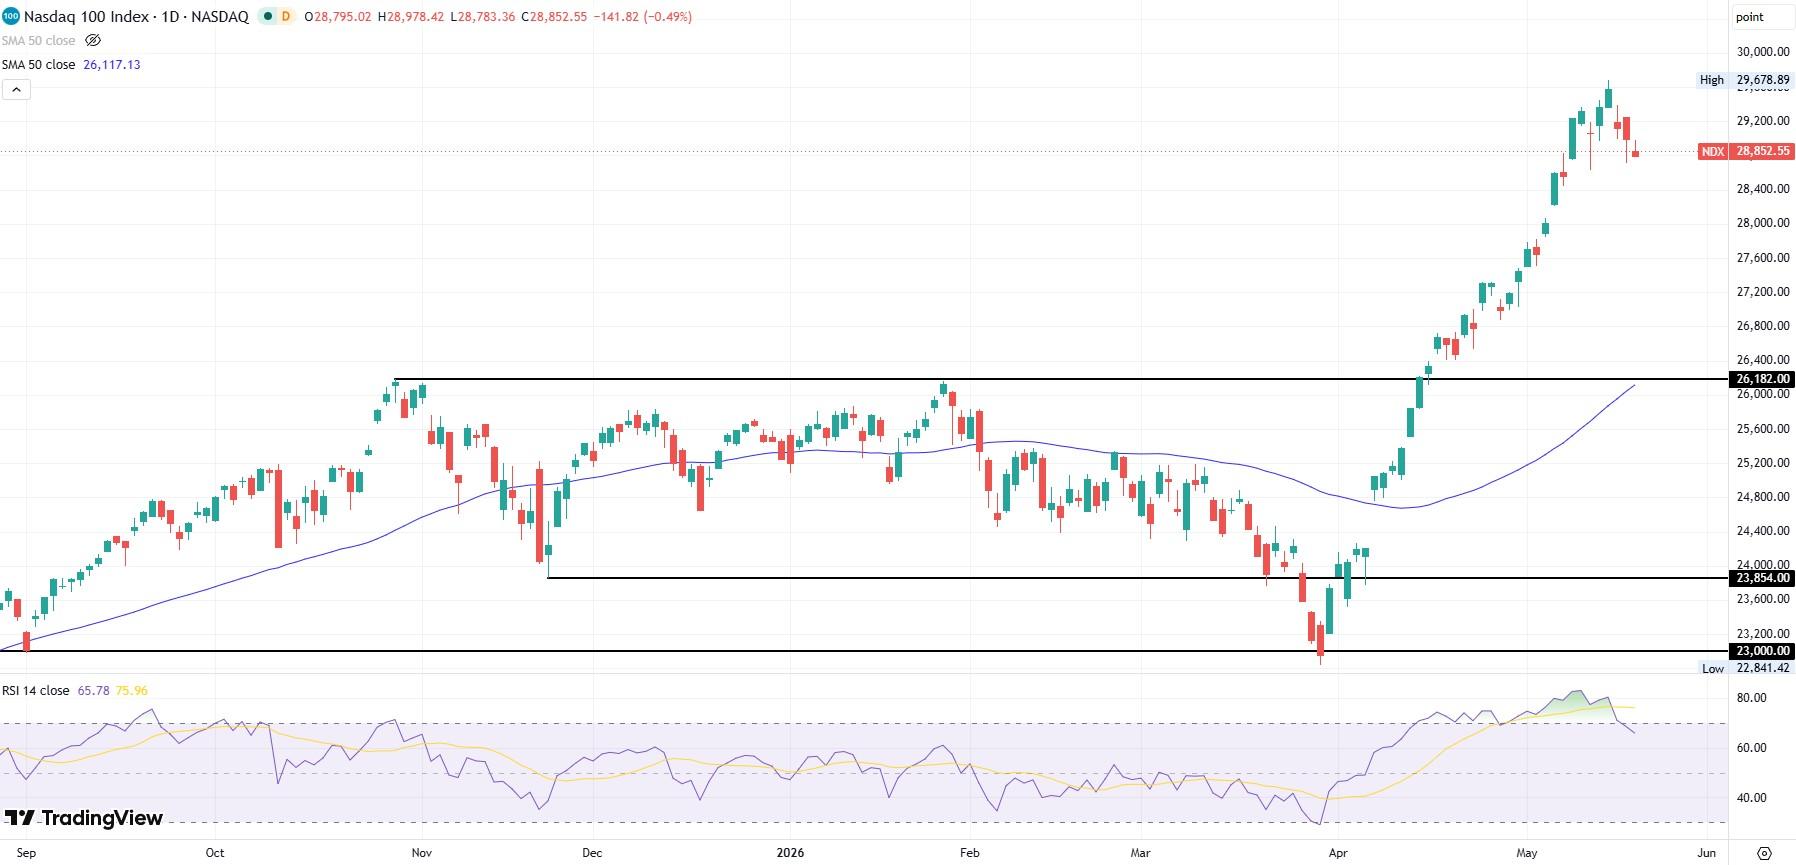
Although bulls strongly expect new all-time highs to develop following Nvidia earnings later this week, the downside option suggests a major plummet if Nvidia fails to oblige. The 50-day Simple Moving Average (SMA) noticeably coincides with the resistance band near 26,182 that joins the October 2025 high with the late January 2026 high. A pullback to that juncture would entail a 9% sell-off from the current theater.
Author

Clay Webster
FXStreet
Clay Webster grew up in the US outside Buffalo, New York and Lancaster, Pennsylvania. He began investing after college following the 2008 financial crisis.