Nasdaq futures hold key structure after rejecting 25,855 and retesting channel support

Daily projections and intraday micro-structure converge as futures compress inside key zones.
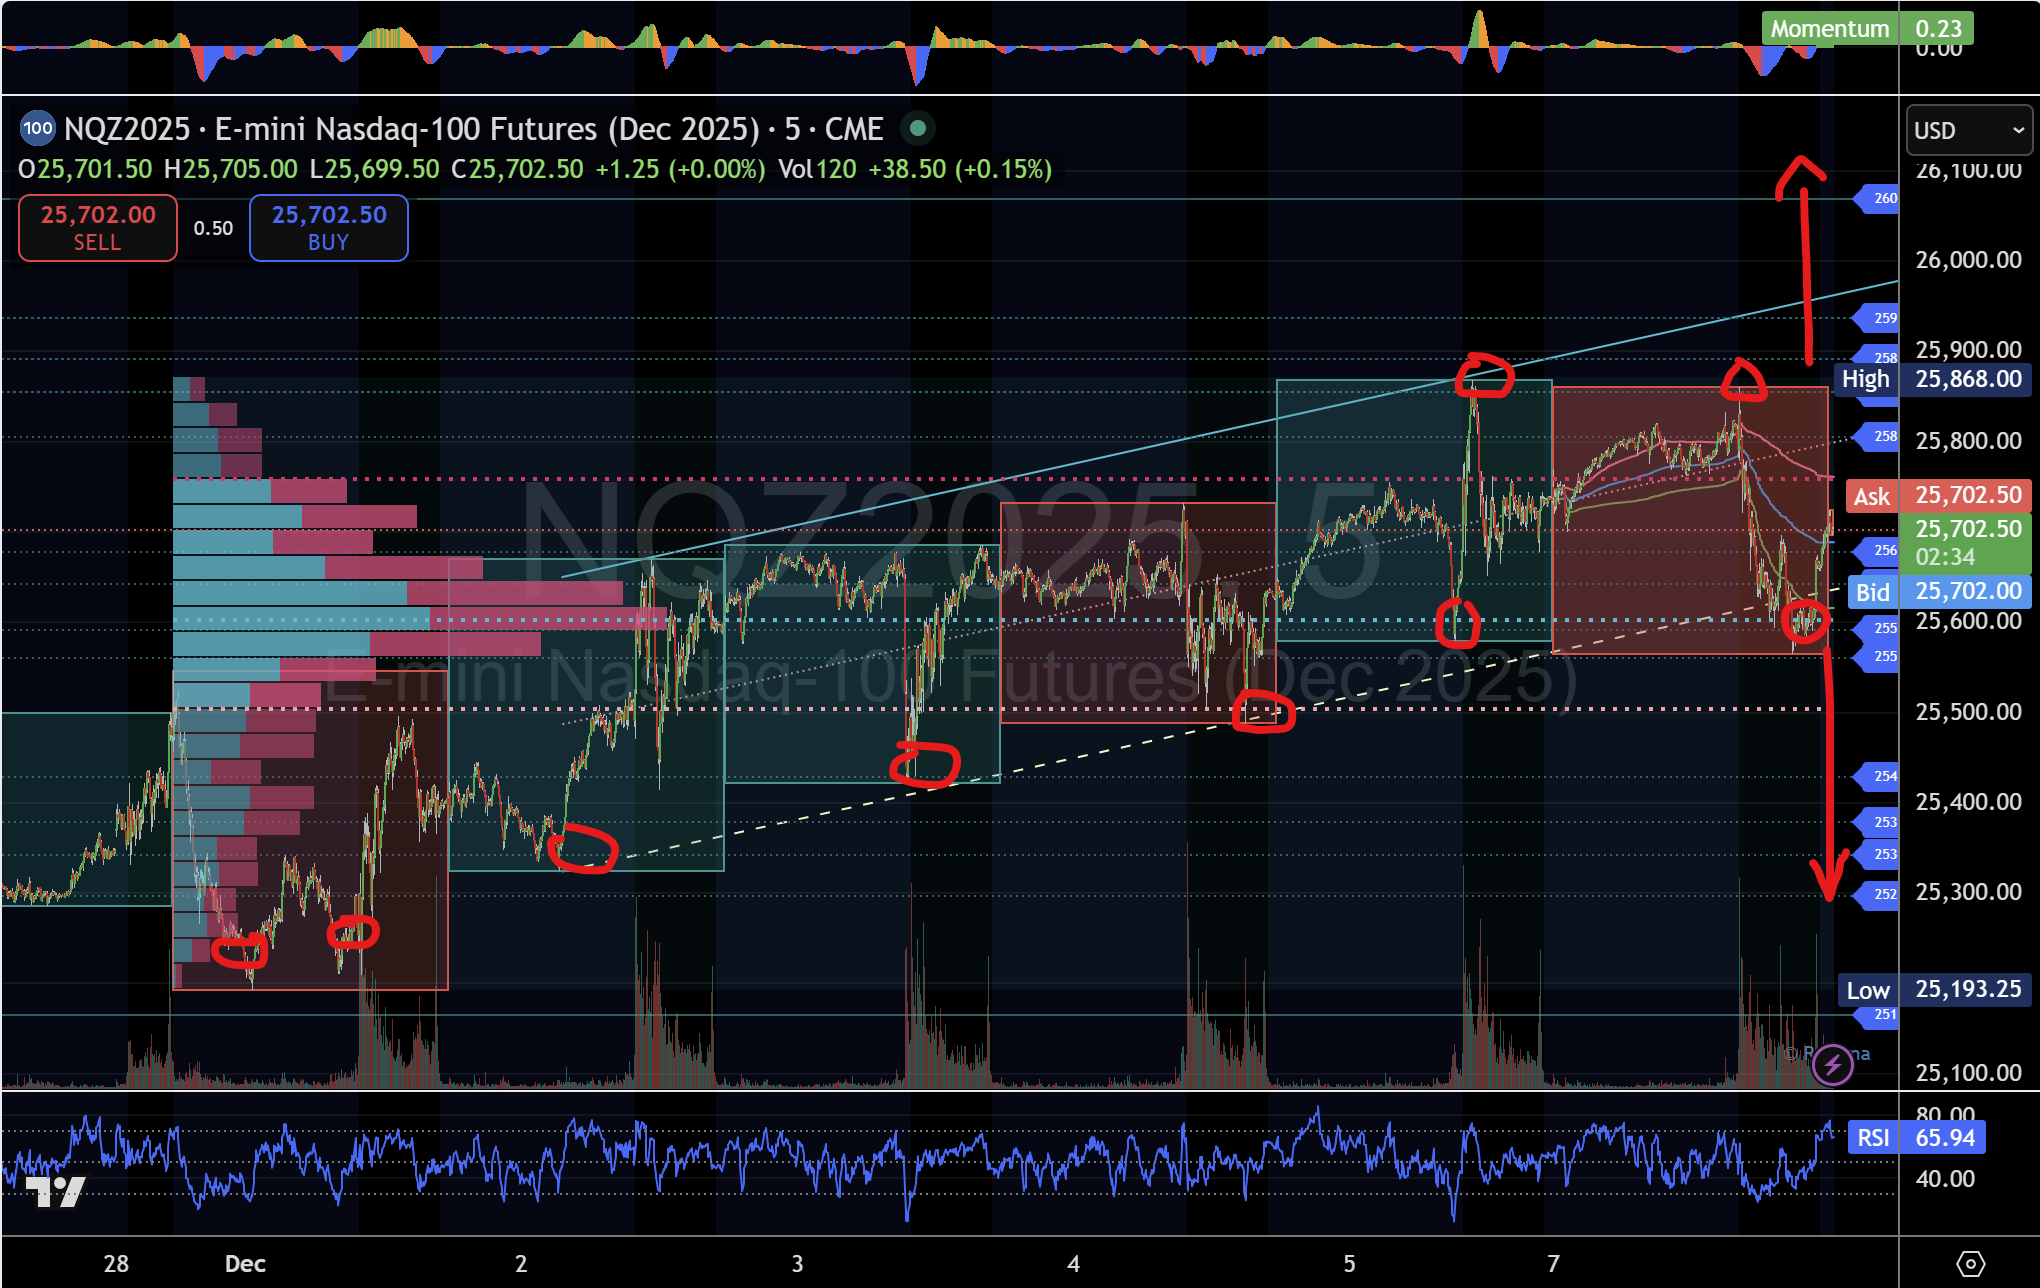
Nasdaq futures rotate sharply after multiple failures at 25,855
During the Monday U.S. session, Nasdaq futures attempted to break into the upper structure again but were rejected at 25,855, the same level that capped upside momentum during the previous session. These failures confirmed 25,855 as a structural ceiling.
The market reversed immediately, slipping through 25,805 and the Monthly VAH, triggering a high-probability 214-point rotation. Price dropped directly into:
- The bottom of the 6-day rising price channel,
- The Monthly POC, and
- The projected intraday support region near 25,591.
This move was a near-perfect structural rotation, fully aligned with the roadmap laid out in prior analysis.
Intraday trend: Still intact but pressing against key boundaries
Despite the sharp reaction, the intraday trend structure remains technically intact. Price continues to defend the lower boundary of the 6-day ascending channel.
As of early Tuesday in the Asian session, the Index trades around 25,719, back above the key intraday pivot at 25,677.
This continues to place emphasis on the middle structure zone, which has been the defining battleground for more than a week.
Key structural zones driving the next move
Middle structure (25,560–25,677): The decision zone
This remains the central pivot in determining direction:
- Hold above 25,560–25,677 → The market may rotate upward and retest the upper structure.
- Lose 25,560 → Opens a path toward deeper rotation.
Every major turn in recent sessions has originated from this band.
Upper structure (25,805–25,936): Bulls must break and hold
Repeated rejections at 25,855 reinforce the strength of this zone.
A breakout through 25,805–25,936 would open the next upside extension toward:
- 25,936, and
- The major daily projection zone at 25,888–26,320.
A clean acceptance above this range would mark a decisive structural shift back in favour of buyers.
Lower structure (25,428–25,297): Downside rotation zone
If the middle structure fails, the next destination is this lower support cluster, which has acted as a reliable rotation point during previous pullbacks.
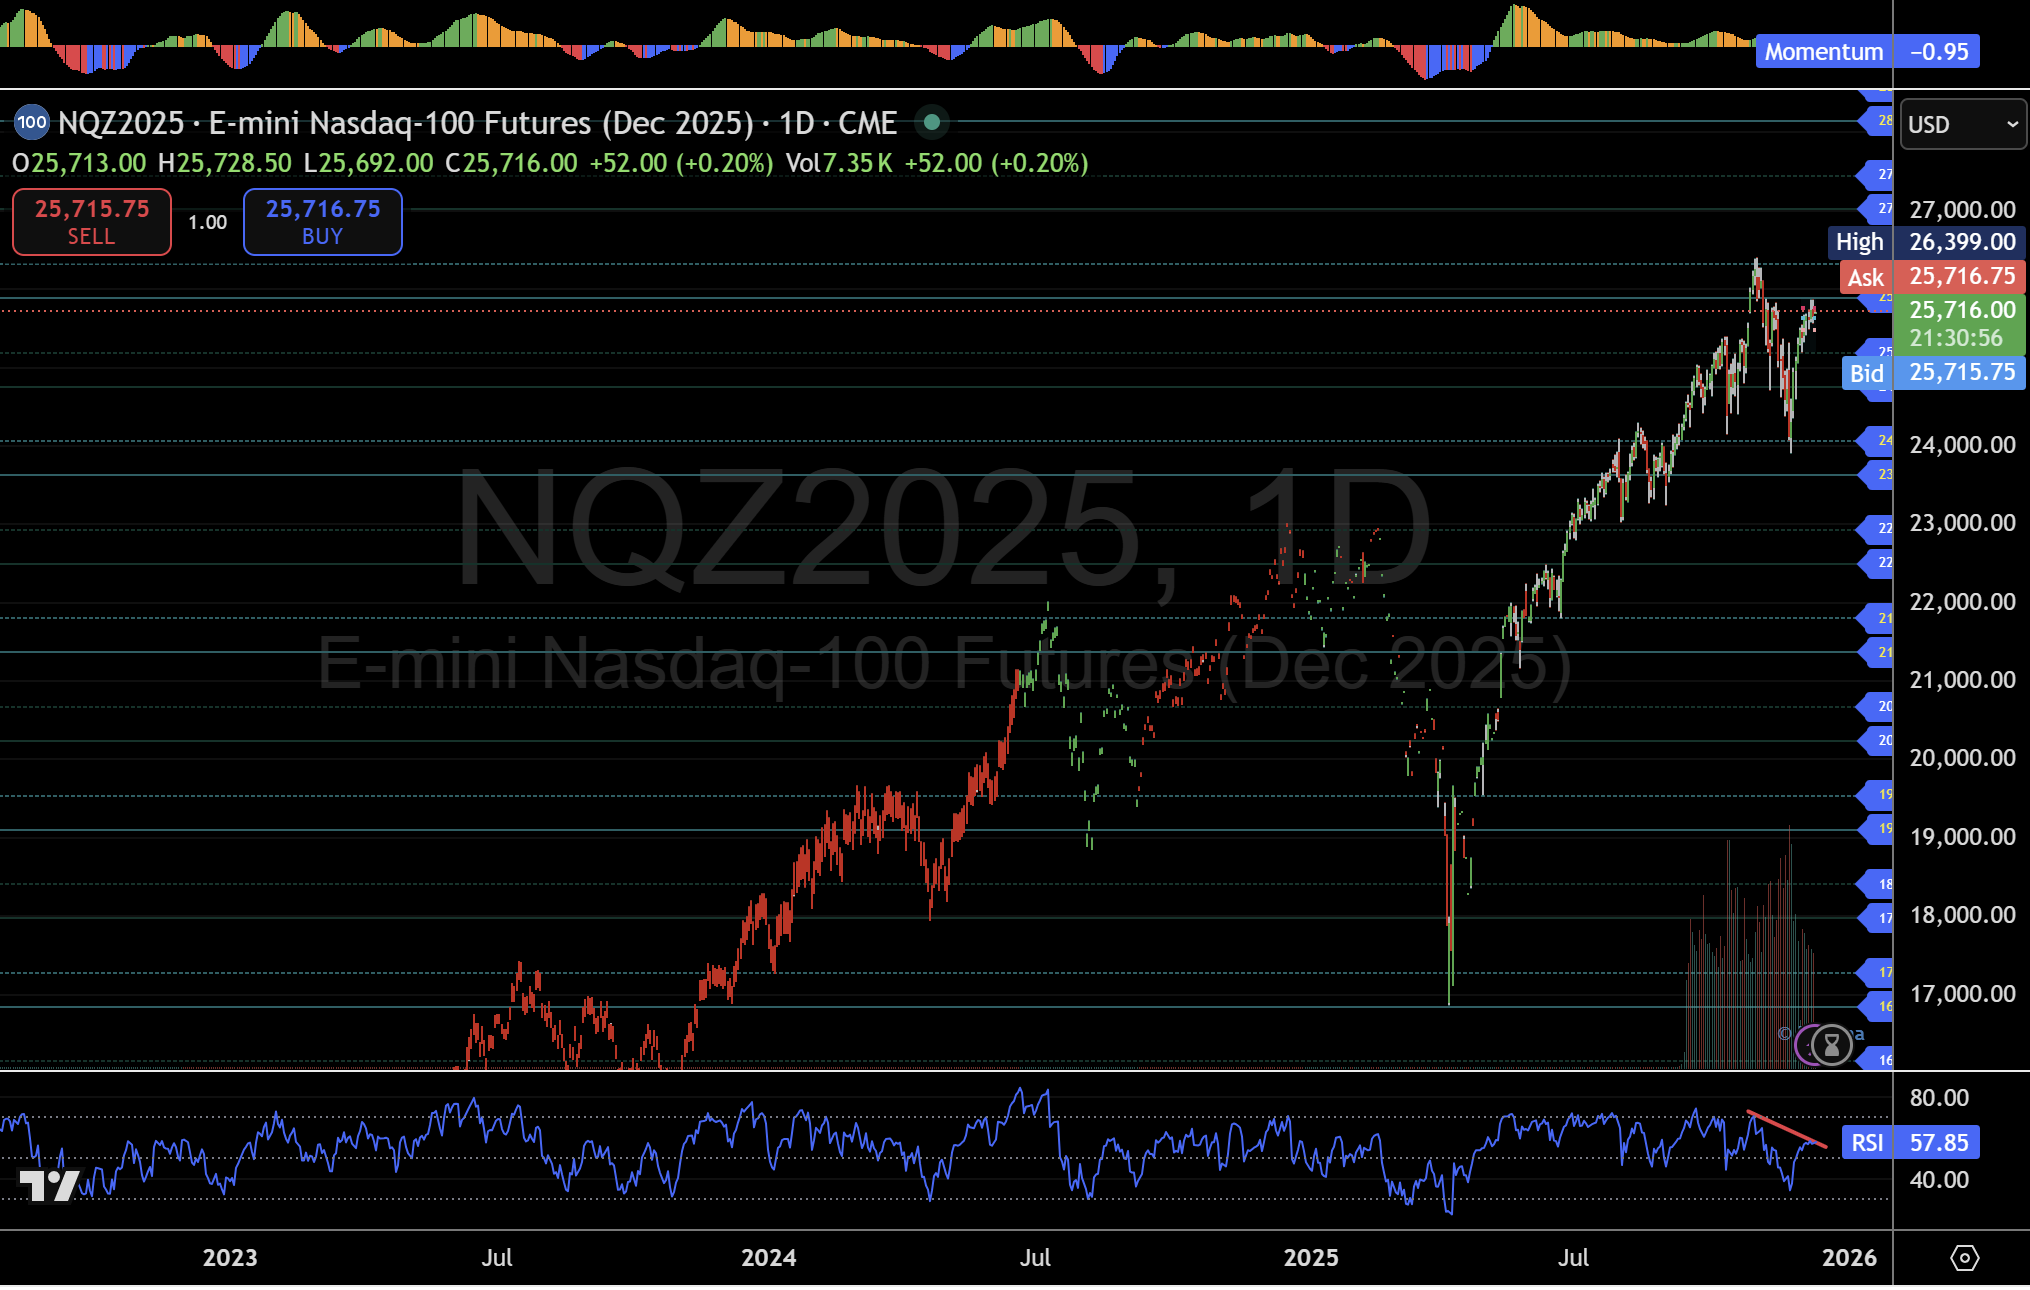
Daily chart: Intraday behaviour mirrors long-range structure
The intraday rejections at 25,855 align perfectly with the broader structural resistance on the daily timeframe.
Price continues to press into a long-range supply cluster between 25,888 and 26,320, while daily RSI shows a developing bearish divergence — signalling a potential pause or pullback unless structure resets.
Despite this, the daily structure remains constructive as long as price holds above 25,560–25,677.
A breakdown below this zone would represent a more material shift in trend character.
Directional outlook (unchanged from previous update)
Bullish scenario
- Defend 25,560–25,677
- Break above 25,805
- Target 25,936, then 25,888–26,320
Bearish scenario
- Lose 25,560
- Rotate into 25,428–25,297
- Evaluate structure for continuation toward deeper levels.
Summary
The Monday session fits seamlessly within the ongoing MacroStructure roadmap.
Price rejected the same upper boundary, rotated precisely to the base of the 6-day channel, and continues to trade inside well-defined structural zones that have guided every major turn.
The market now sits at a crucial junction:
- Hold the middle structure → upward rotation resumes.
- Break below → deeper structural retest underway
With both the daily and intraday levels aligned, the roadmap for the next move remains clean and actionable.
As this session demonstrated, structure continues to lead the market. Price follows, and the news typically arrives later.
This analysis is for informational purposes only and does not constitute investment advice. Markets involve risk, and past performance does not guarantee future results.
Author

Denis Joeli Fatiaki
Independent Analyst
Denis Joeli Fatiaki possesses over a decade of extensive experience as a multi-asset trader and Market Strategist.