NASDAQ 100 on pace for its worst daily performance since Trump tariffs
- NASDAQ 100 loses nearly 4% in late going on Friday.
- Better hiring in May has traders expecting interest rate hikes later this year.
- Much of the selling is focused on tech and semiconductor stocks.
- Friday could be the worst single-day performance for NDX since April 4, 2025.

With an hour to go in Friday's regular market, the NASDAQ 100 (NDX) is facing its worst sell-off since US President Donald Trump's tariff announcement in April 2025. The NASDAQ 100, which holds the 100 largest non-financial stocks, has jettisoned its strong two-month rally. The index is down 3.87%, its worst sell-off since April 4, 2025, when Trump's tariff announcement led to a 6.07% single-day drop.
The culprit was the positive jobs report, which, before the market opened, showed new hiring in May reached 172K, well above the 85K forecast. An improving jobs picture in the US means that the Federal Reserve (Fed) is more likely to refocus on rising inflation, with a rising possibility of hiking interest rates. The stock market traditionally hates rate-hiking cycles, which strongly discount the value of future earnings.
If a late afternoon rally doesn't arrive, the index will surpass the 3.56% loss witnessed on October 10, 2025, when Trump threatened new tariffs on China.
The heat map below shows that the worst-hit sector is clearly technology, which led the current rally that began on March 30 of this year and began a spectacular run-up after the US and Iran began their tumultuous ceasefire on April 8.
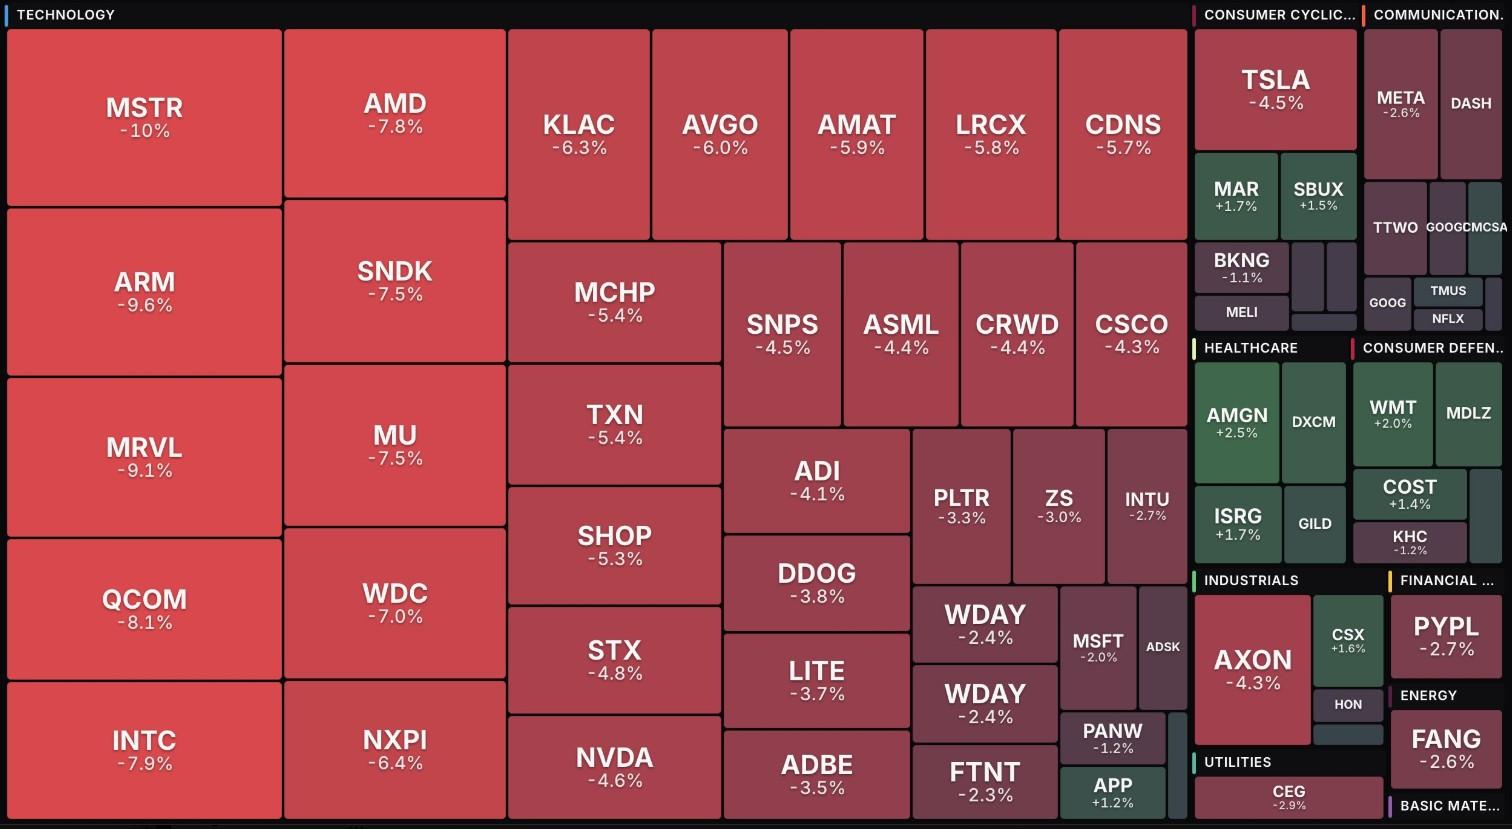
Strategy (MSTR) is leading the pack lower as Bitcoin (BTC) loses 6.5% to trade below $60,000. Many of the tech stocks hit worst are semiconductor stocks like Arm Holdings (ARM), Advanced Micro Devices (AMD), Marvell Technologies (MRVL) and Micron (MU).
Larger tech stocks like Microsoft (MSFT), Tesla (TSLA) and Nvidia (NVDA) are down between 2% and 5%. NAND maker Sandisk (SNDK), one of the best performers of the year, fell over 13%.
Sell in May and go away?
The NASDAQ 100 is bleeding for now, but support might show up fairly soon. A support band lies between 28,600 and 28,900 on the daily chart below. But a break of that nexus would have traders expecting a further drop to the 50-day Simple Moving Average near 27,450.
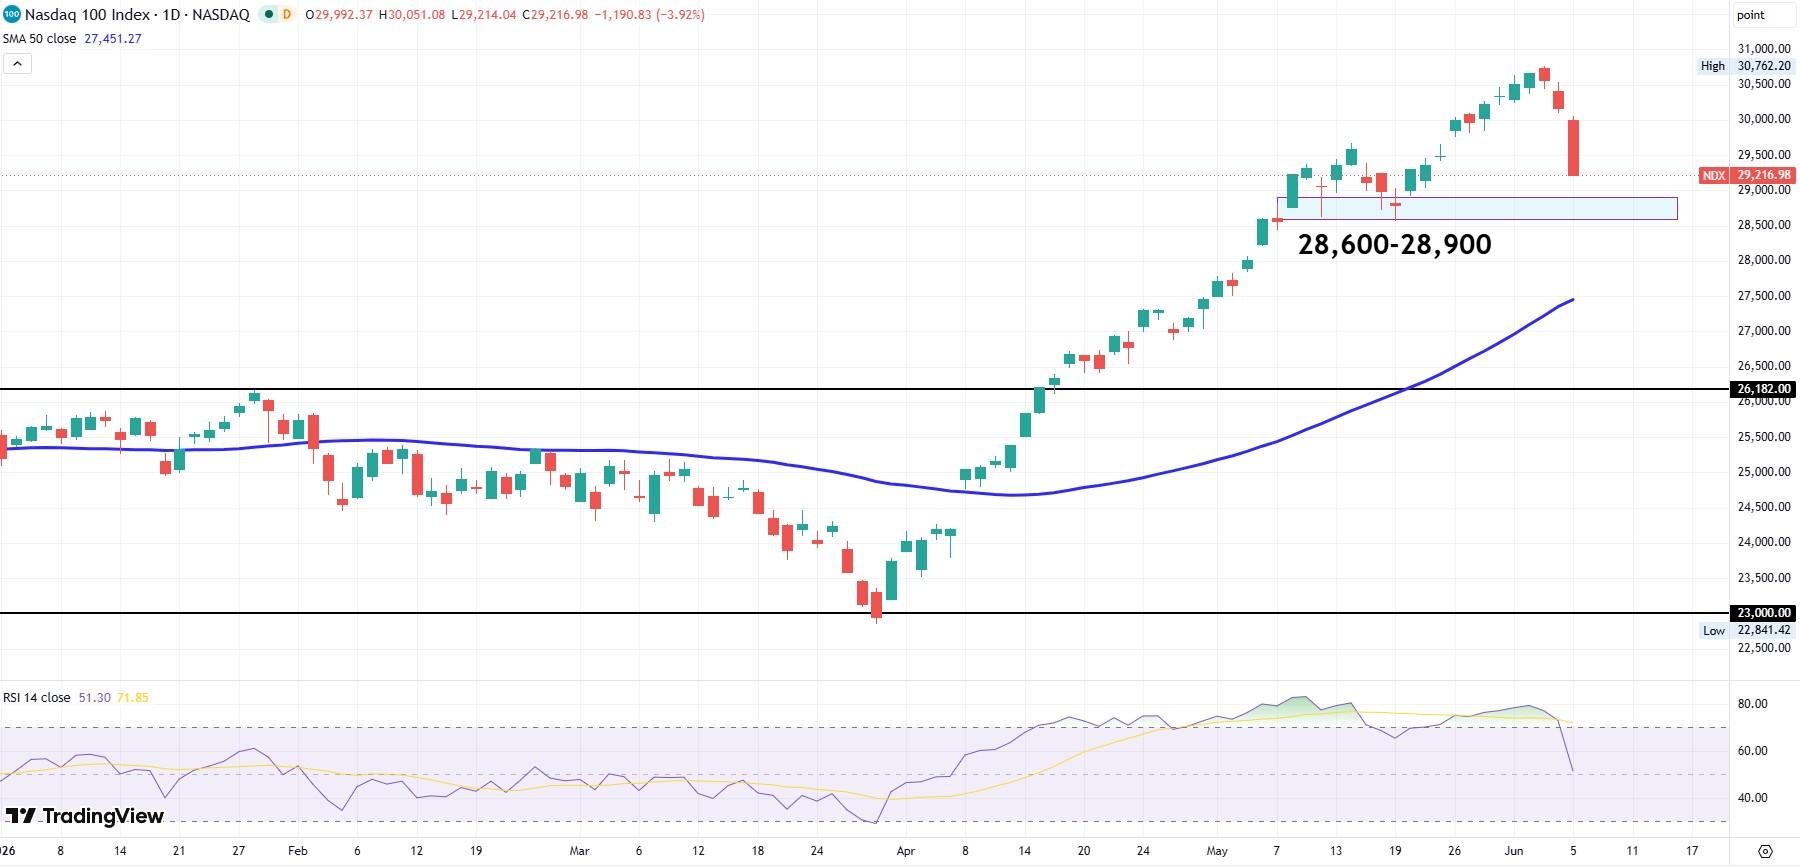
As it stands, investors should have been expecting this since the index got notably ahead of the 50-day SMA over the past two months, a somewhat rare instance. The Relative Strength Index (RSI) had been drifting in overbought territory (above the 70 threshold) since mid-April.
Author

Clay Webster
FXStreet
Clay Webster grew up in the US outside Buffalo, New York and Lancaster, Pennsylvania. He began investing after college following the 2008 financial crisis.


