NAS100 forecast: A second-day pullback meets a 5.1% bond market

NAS100 forecast: A second-day pullback meets a 5.1% Bond market — Sep 24, 2026
- The daily uptrend is pulling back, and the 4-hour chart is pointing lower.
- The 10-year yield is at 5.11%, a 2007 high, and remains the main headwind.
- I favour selling a bounce into 1-hour resistance, with 30,420 as the target.
The daily chart says uptrend. The 4-hour chart says the uptrend is on pause. The bond market says the pause isn't finished. Tonight, New York decides which one is right.
This NAS100 forecast comes down to one conflict. The daily trend is still up, but price is in its second day of pullback, and the 4-hour chart has already turned lower. Behind it, the 10-year Treasury pushed to about 5.11% in Asia, its highest since 2007, and the dollar sits near a two-month high. US futures edged lower overnight. With Trump–Xi talks during the US day, the question for New York is simple: is this a dip to buy, or the start of something deeper?
What happened yesterday
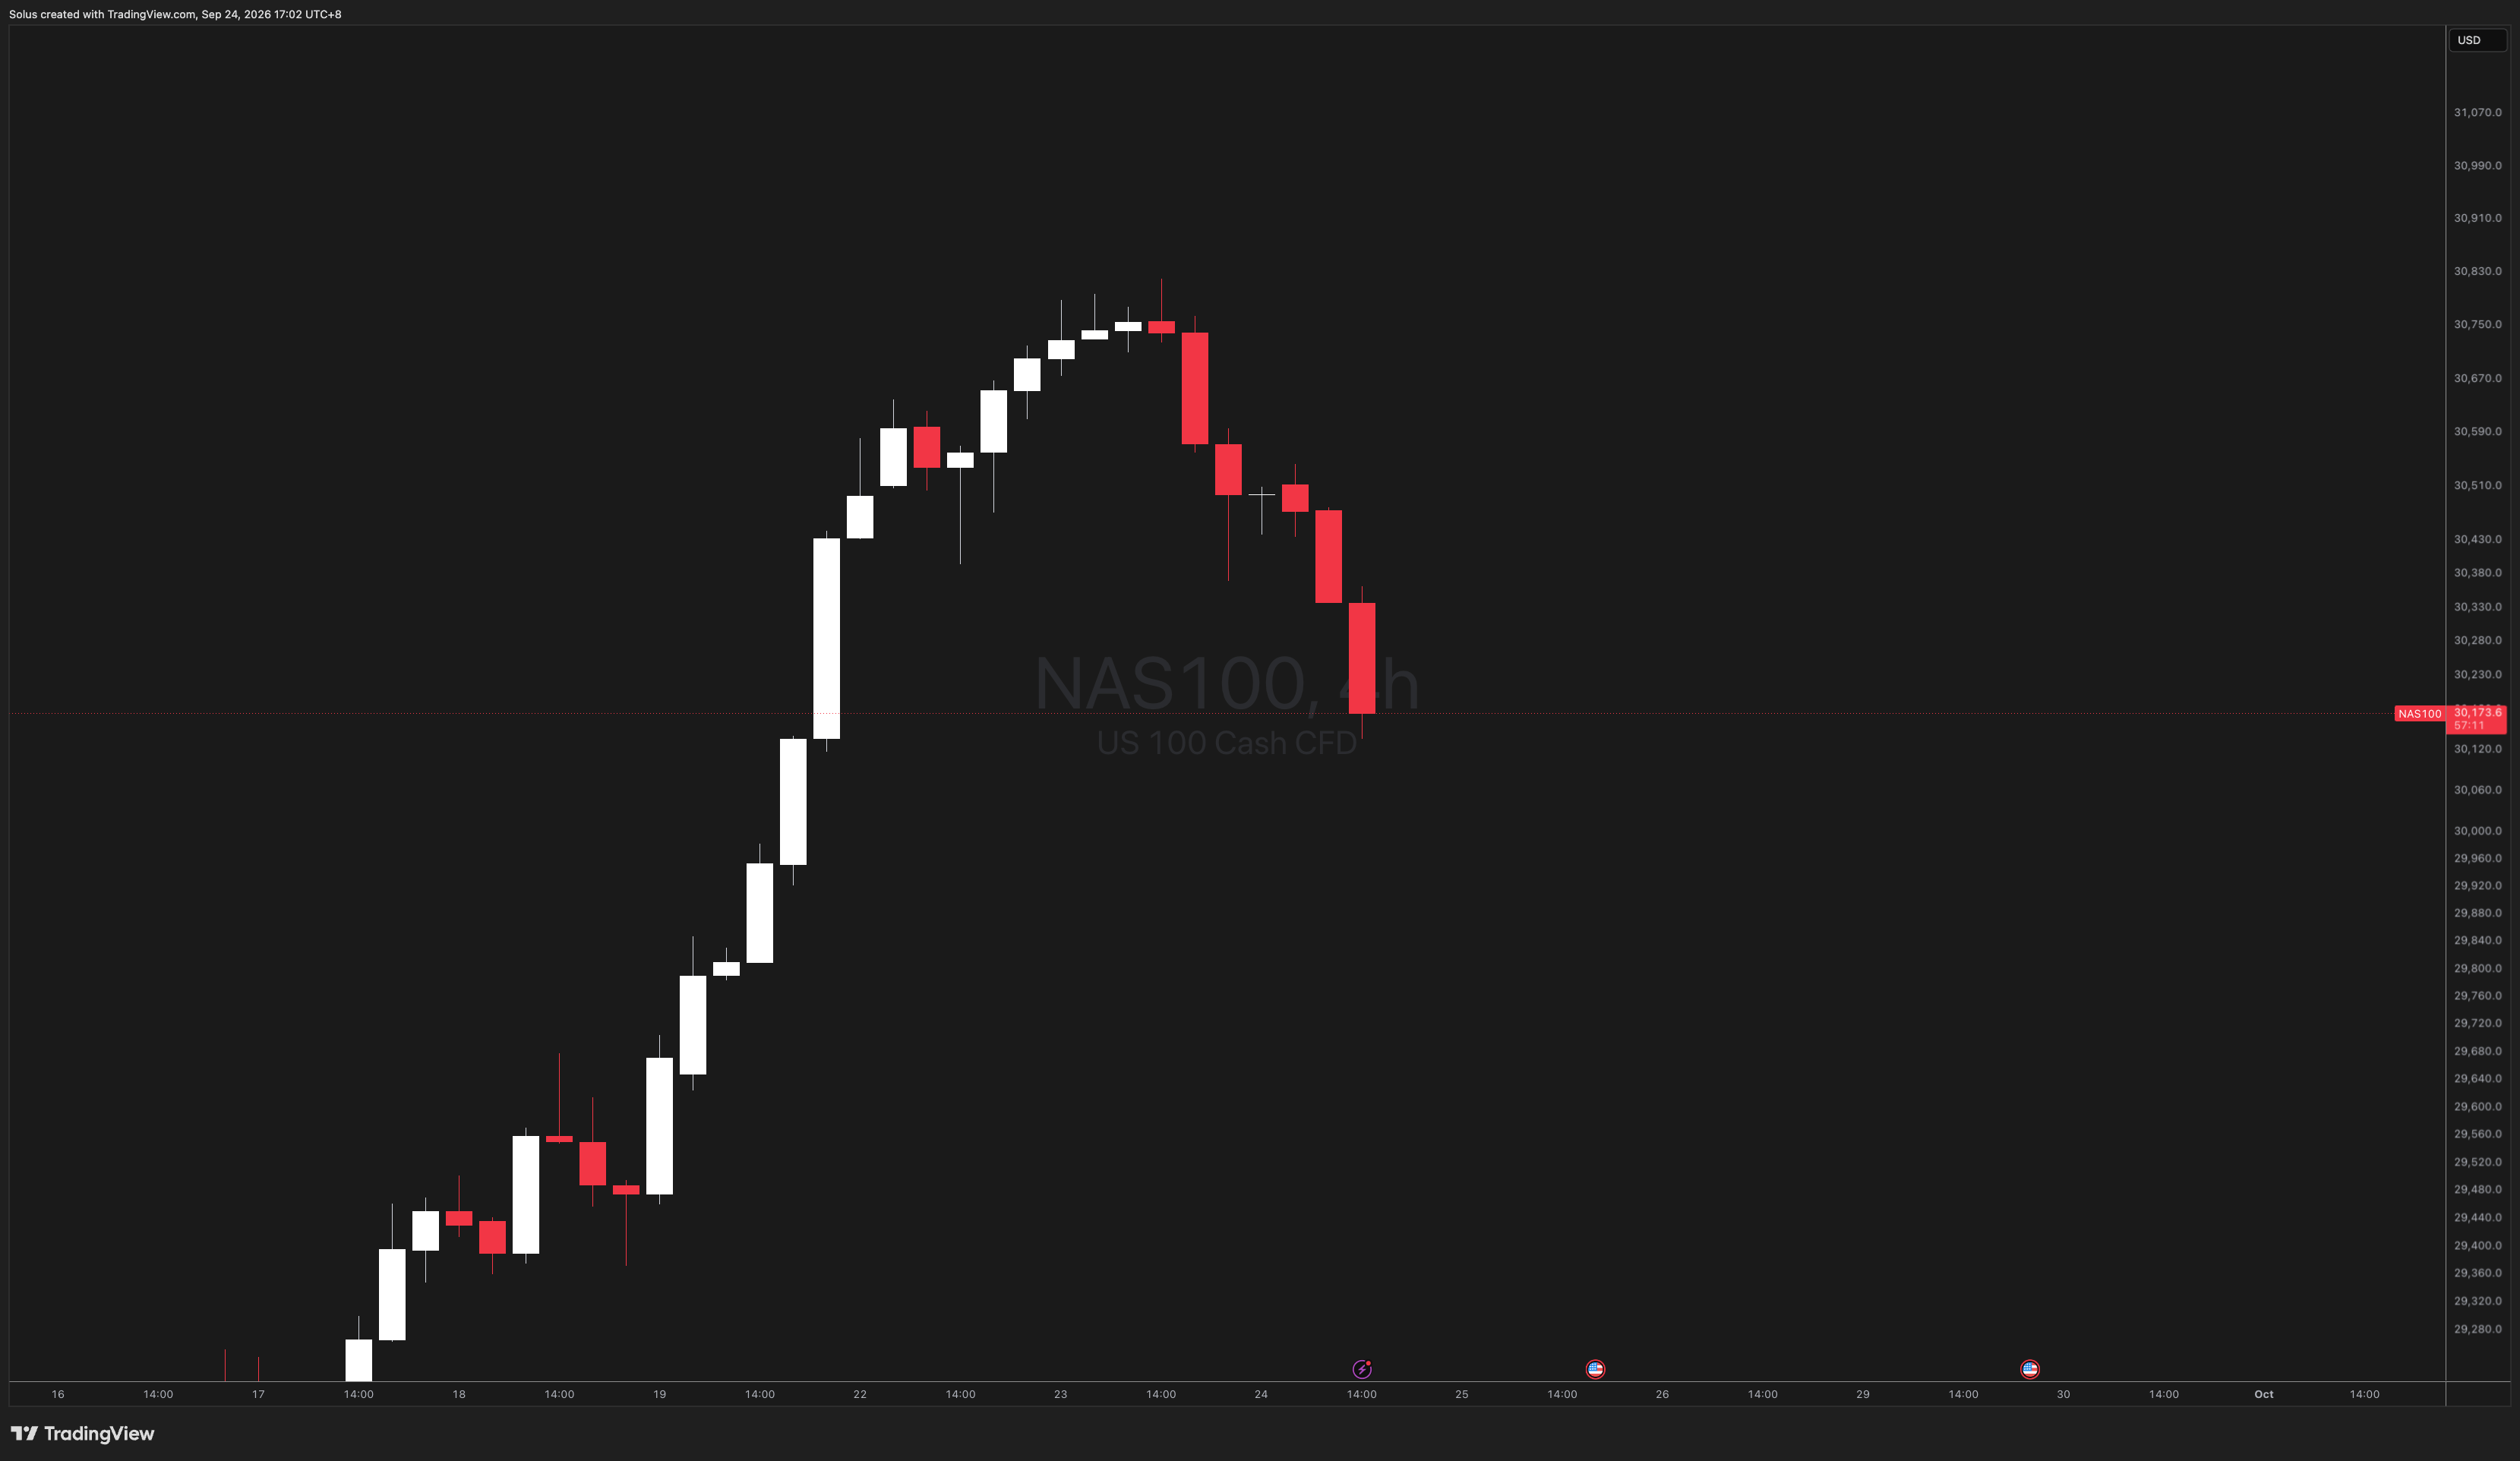
The bear case played out. London briefly pushed above the highs near 30,845 and got rejected, the flash PMI came in hot (58.4 vs 56.0), the 10-year broke 5%, and the Nasdaq closed down about 1.1%. Price fell through the 30,500–30,680 area it had raced through on Tuesday and was trading near 30,467 by midday today, just above my 30,420 extended target. The downside objective is nearly done, so the question now is where the drop stops, not whether it happens.
Why bonds are still running the Nasdaq
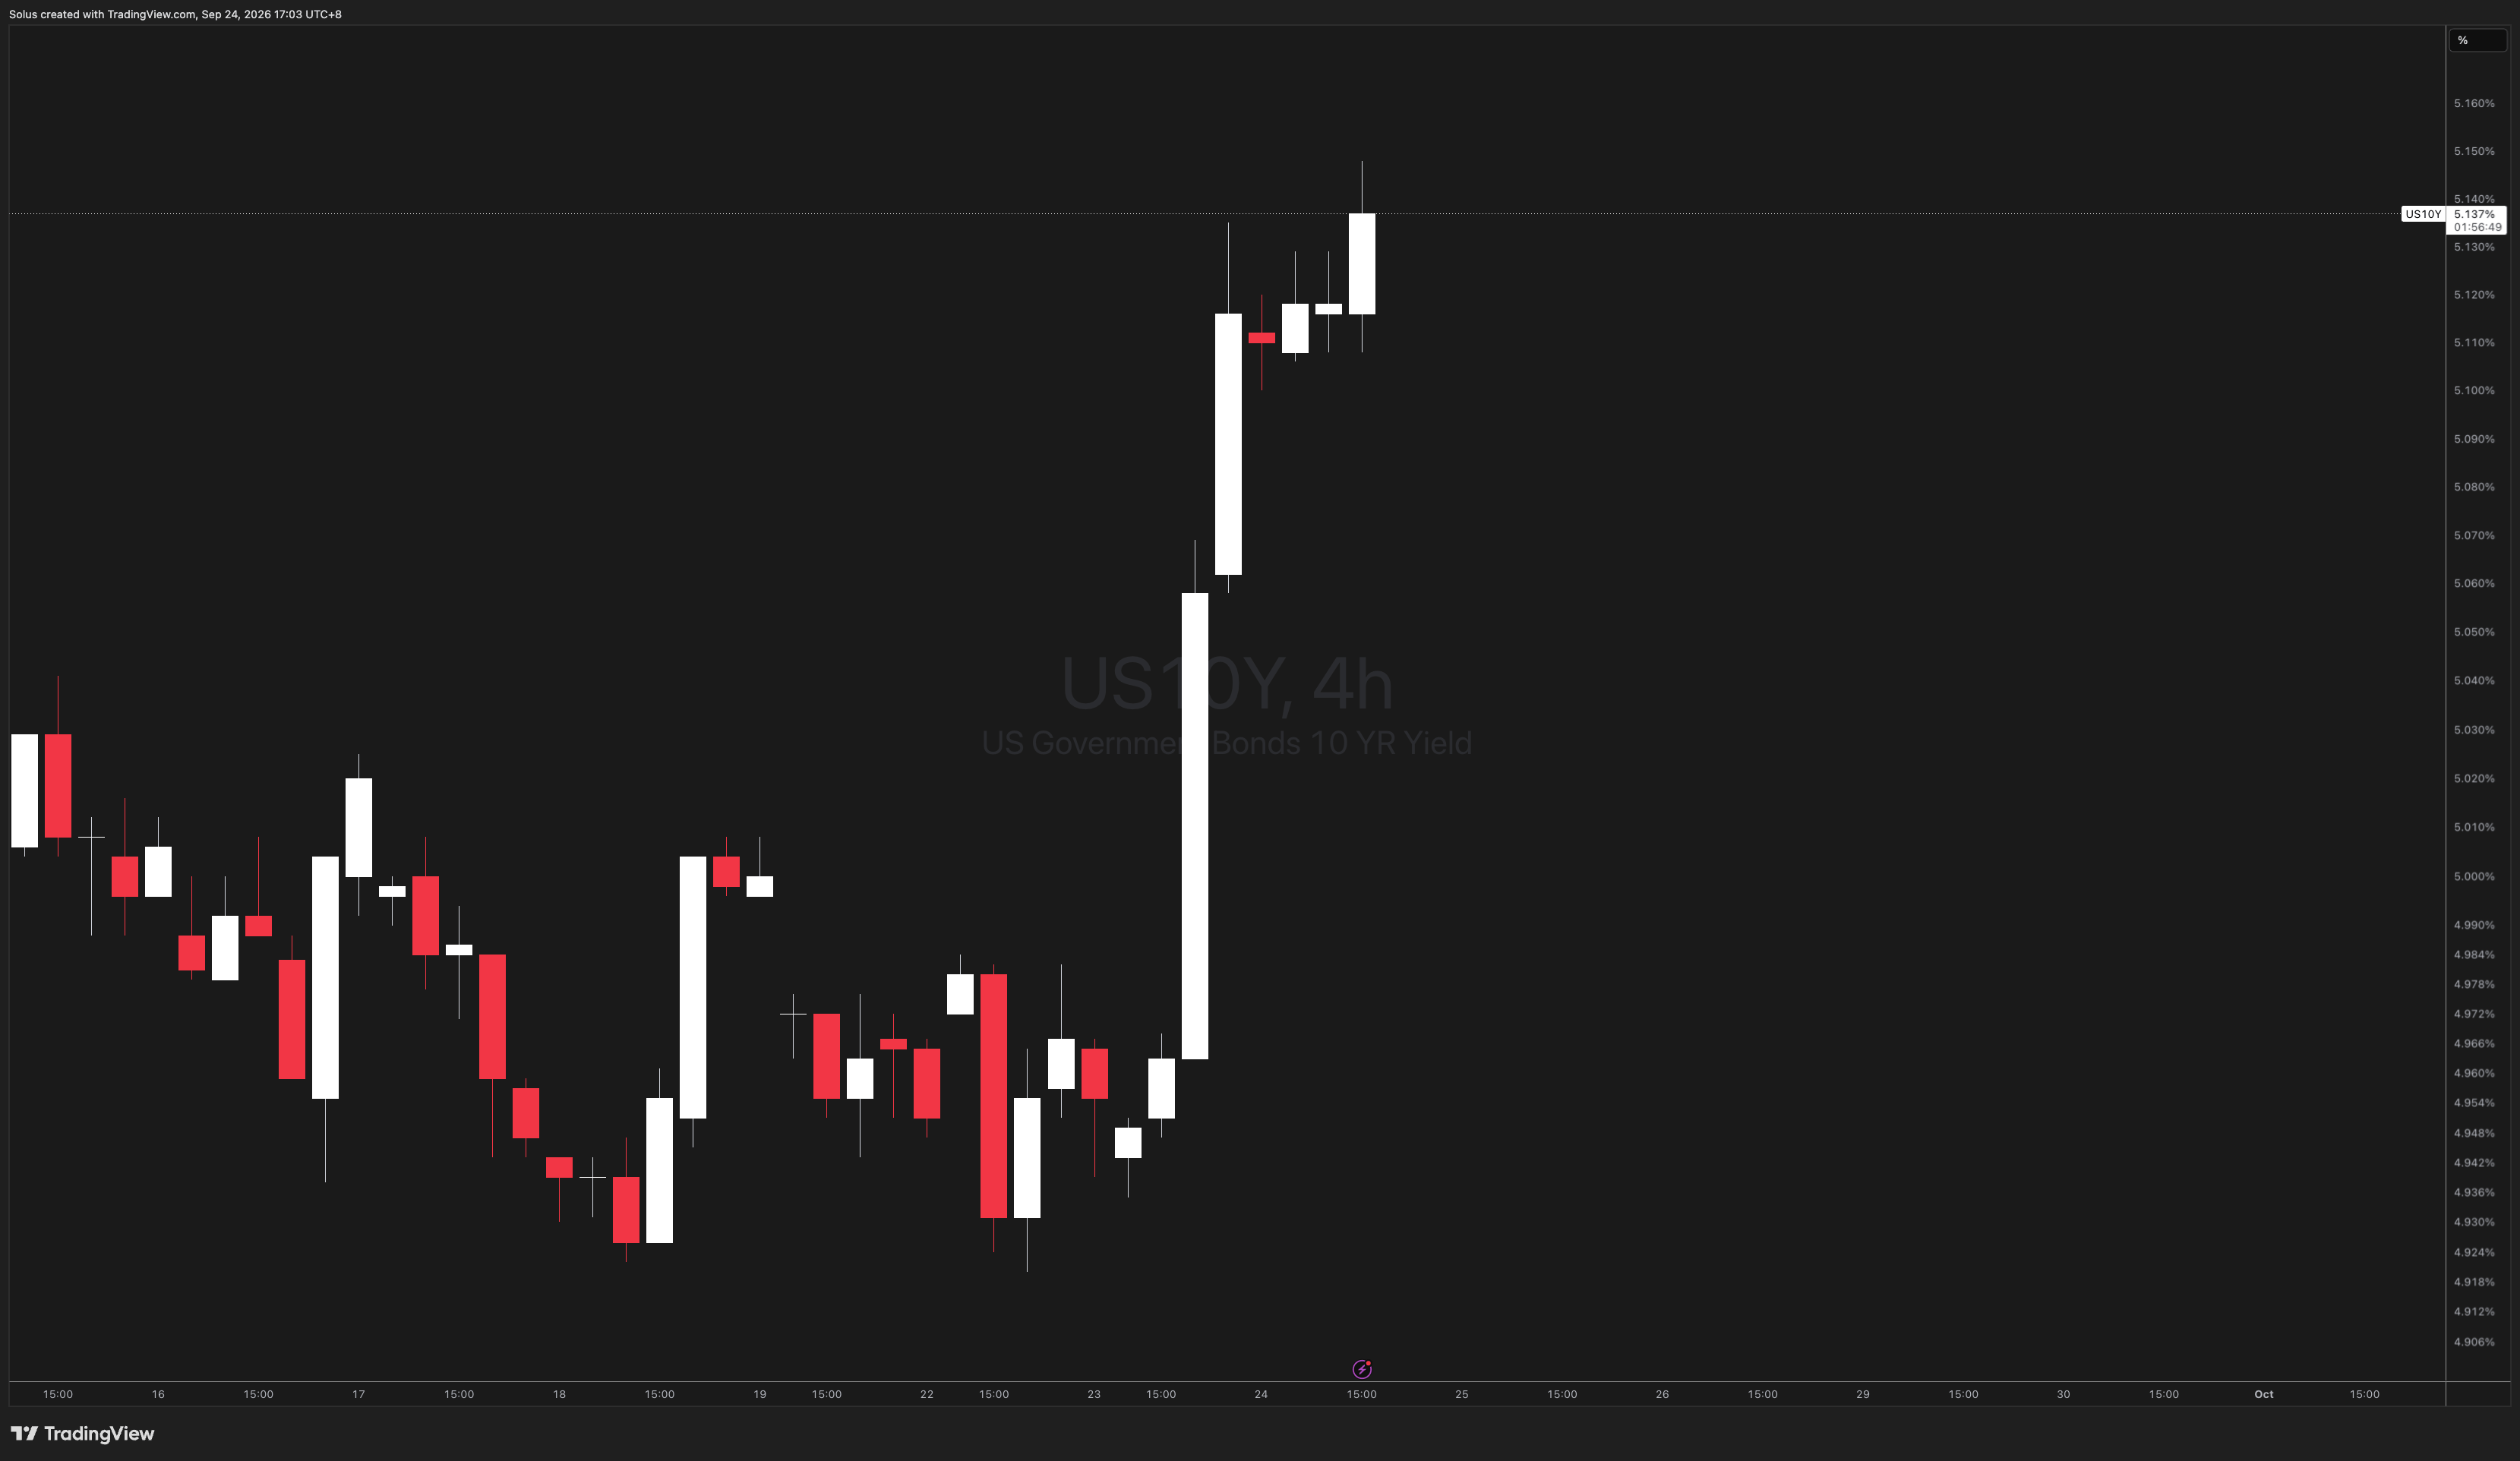
The yield move didn't stop at the US close. The 10-year kept climbing into Asia, the 30-year is above 5.4%, and October hike odds sit around 70% after last week's hike. Tech is the most rate-sensitive part of the market, so every leg higher in yields is a leg lower in valuation. China and Hong Kong fell 1–1.5% overnight, and there's no relief in sight until bonds blink.
Today's calendar: Claims before the open
ForexFactory's impact colours didn't load on my pull. None of these is normally a red folder, but claims land an hour before the open and set the first read on yields.
Event | Time (ET / PHT) | Forecast | Previous |
|---|---|---|---|
US Jobless Claims | 8:30 AM / 8:30 PM | 201K | 196K |
Fed's Hammack Speaks | 8:50 AM / 8:50 PM | — | — |
New Home Sales | 10:00 AM / 10:00 PM | 615K | 607K |
Fed's Paulson Speaks | 10:10 AM / 10:10 PM | — | — |
The Trump–Xi talks cover trade, AI and technology, which makes them two-way headline risk for chip stocks. Costco, an index member, reports after the close (EPS forecast $6.55), so that's tomorrow's story.
Rates and Dollar check: The pressure hasn't eased
Where they sit before the open
- 10-year Treasury yield: about 5.11%. It's at a 2007 high and holding above the 5% line it broke yesterday.
- 5-year Treasury yield: above 5%. It topped 5% for the first time since 2007. The 5-year tracks where the market thinks the Fed is heading, so this pressure hits the whole index.
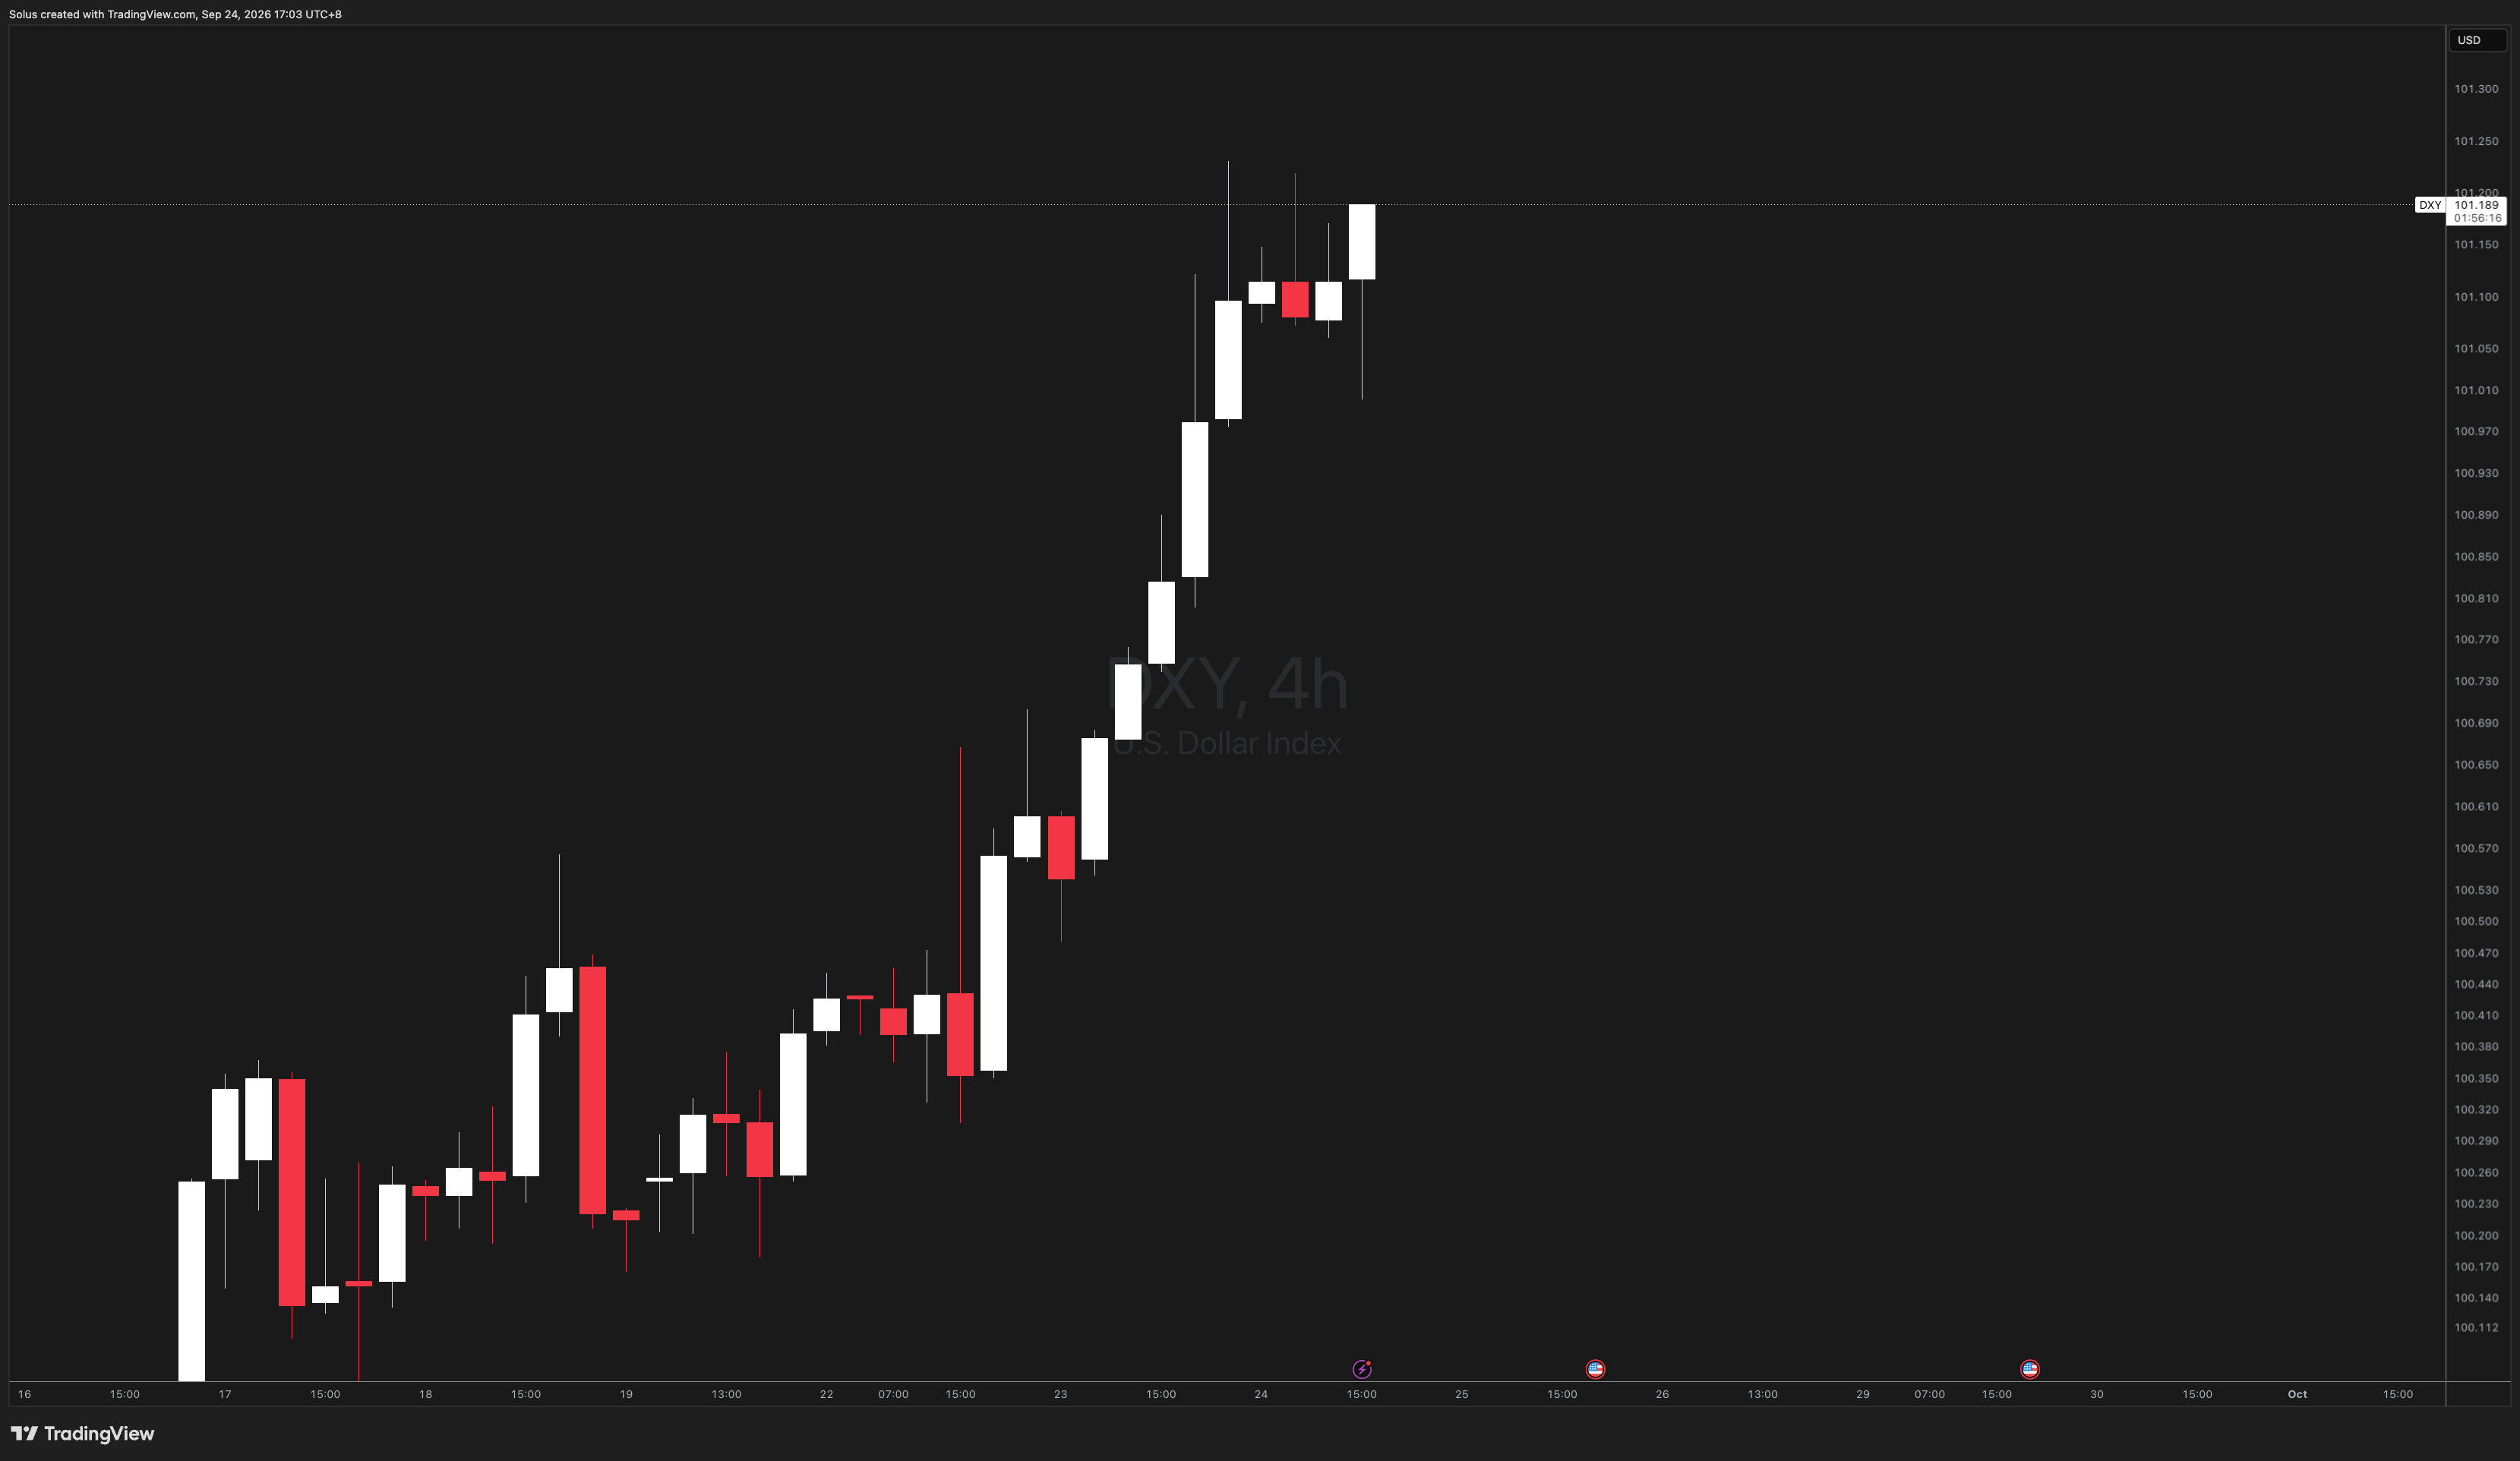
- US Dollar Index: around 100.85, after a 100.96 two-month high. Scotiabank's fair-value estimate is 101, so the dollar has room to firm.
What I'm reading at the open
Into 9:30 PM | What it means for NAS100 |
|---|---|
Low claims, 10-year pushes above 5.11% | The pullback extends. The bear case is on. |
Claims in line, yields flat | No new fuel. Expect a range at the lows. |
High claims, 10-year back toward 5% | Relief bid. The daily uptrend gets its chance. |
Yields spike, then reject with a wick | Often a Nasdaq low. The bear case is paused. |
[Insert chart: Nasdaq 100 with the 10-year yield and US Dollar Index]
NAS100 technical outlook: Daily up, four-hour down
Structure and Location
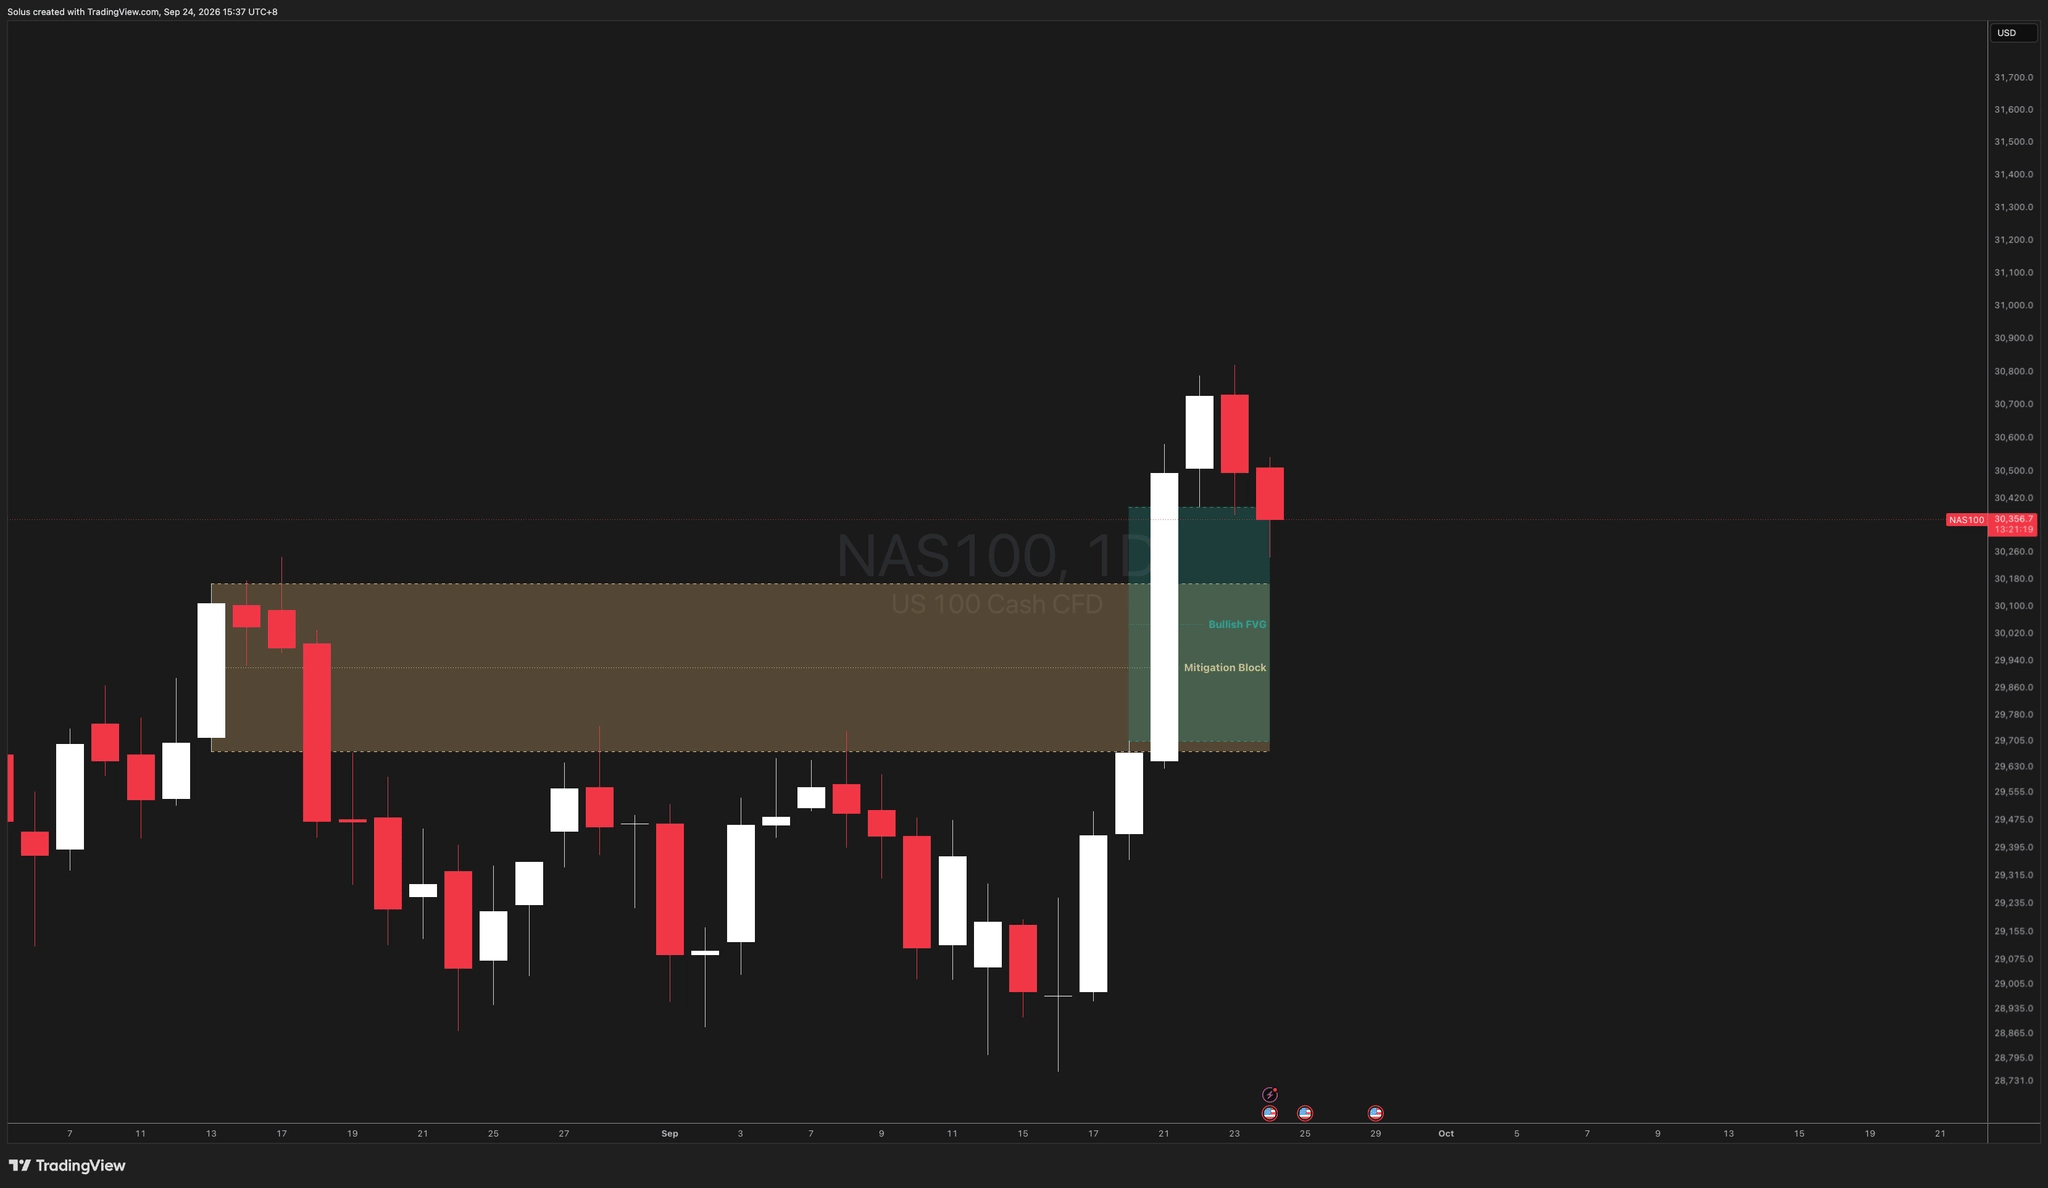
The daily uptrend is intact, but this is a second-day pullback. If today also closes red, that usually points to more pullback before the trend resumes.
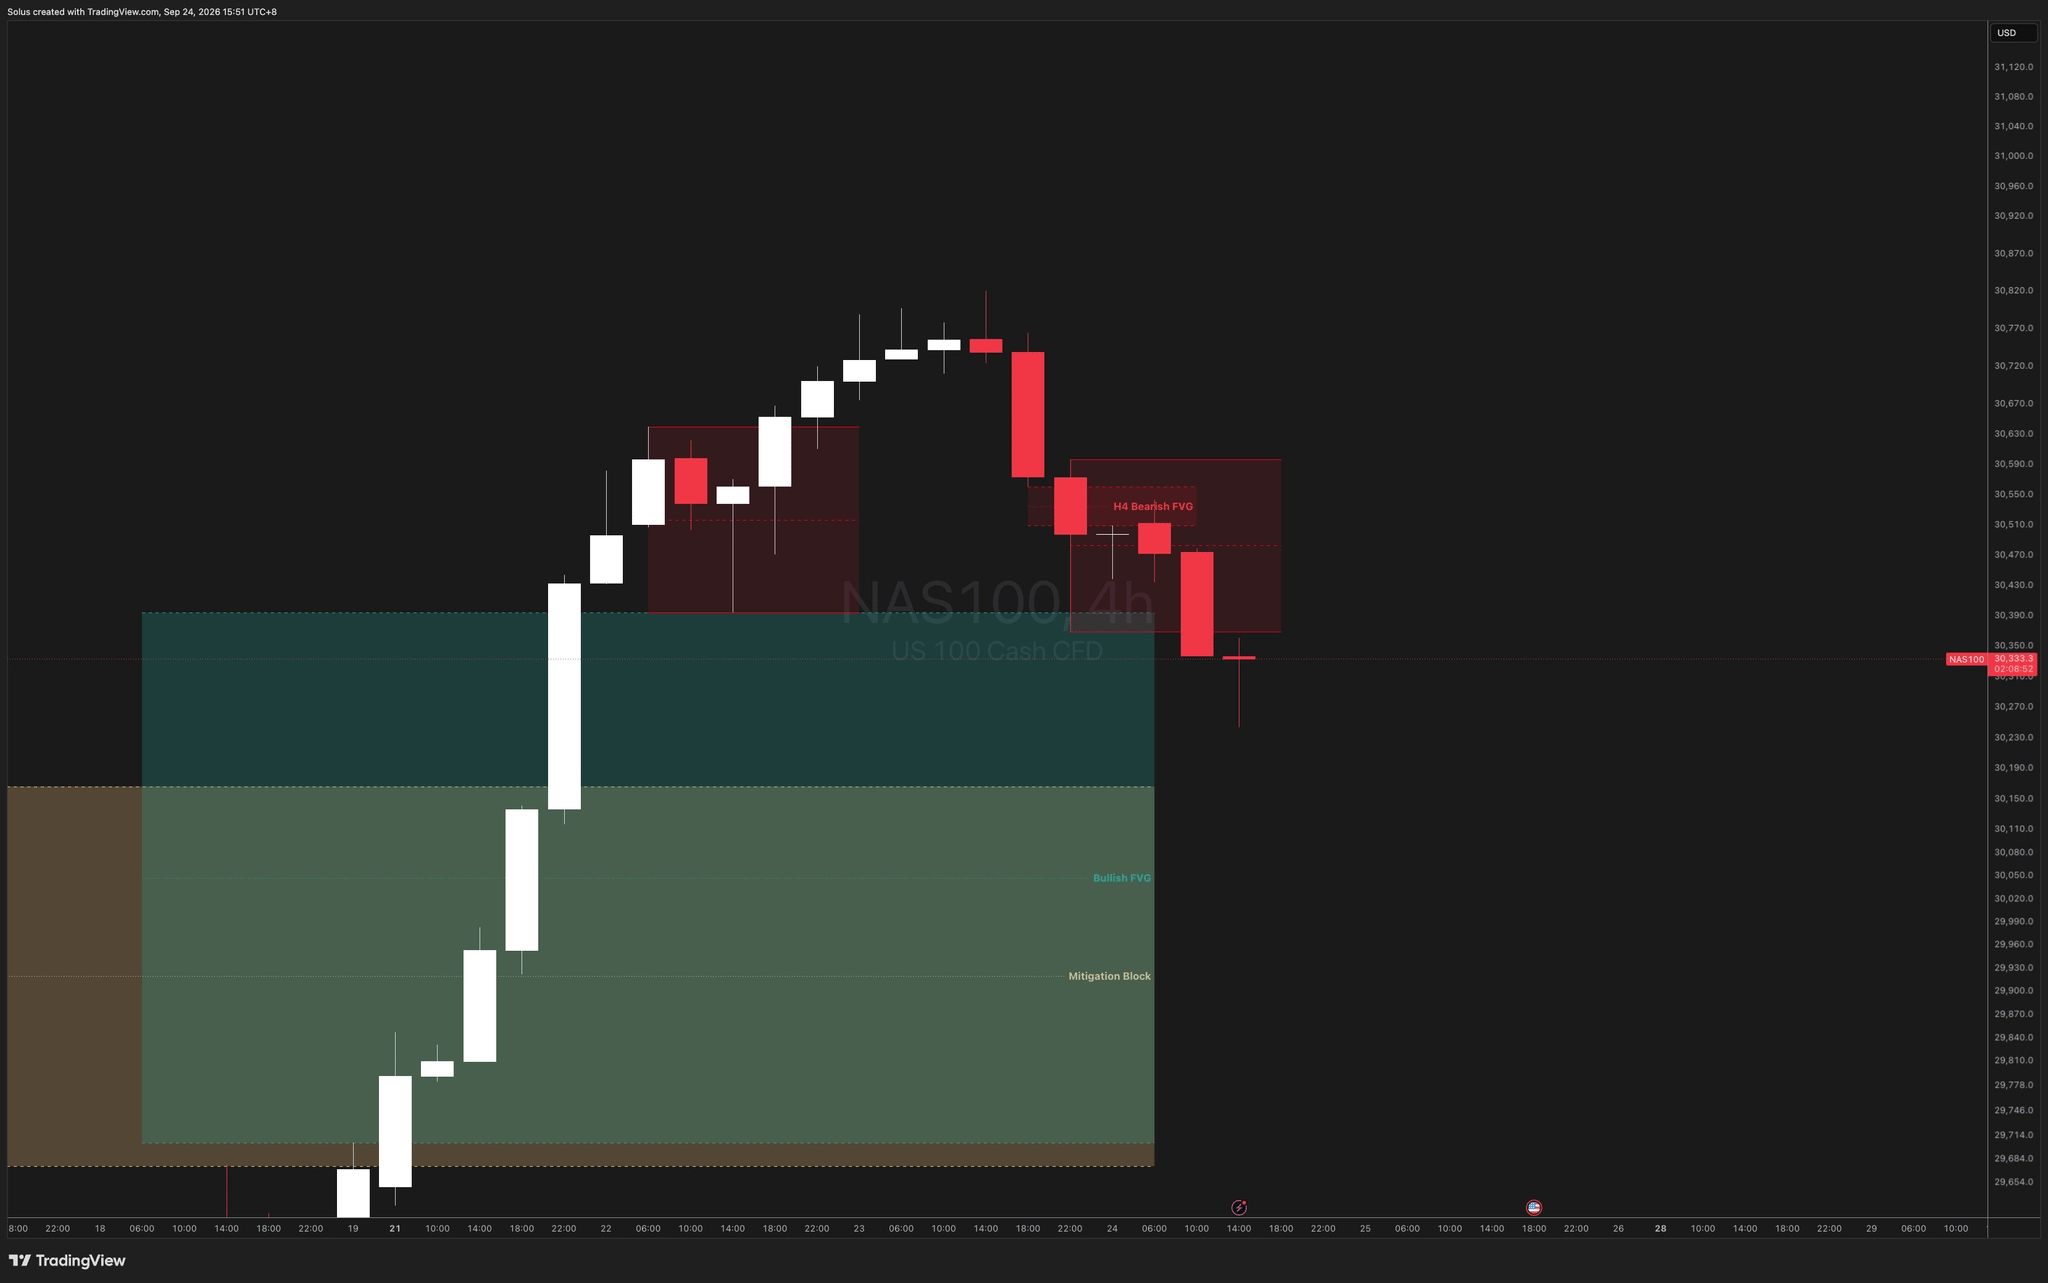
On the 4-hour chart, the drop started when price was rejected from a zone where sellers had stepped in before, and it has since made a lower low. Overhead, the first resistance is a 1-hour selling zone that sits where a typical bounce would retrace to, roughly 62–79% of the latest drop. Above that is a bigger selling zone. Below, Tuesday's 30,420 low is the last obvious level where stop-losses are likely stacked.
Bullish scenario: A break above the upper selling zone
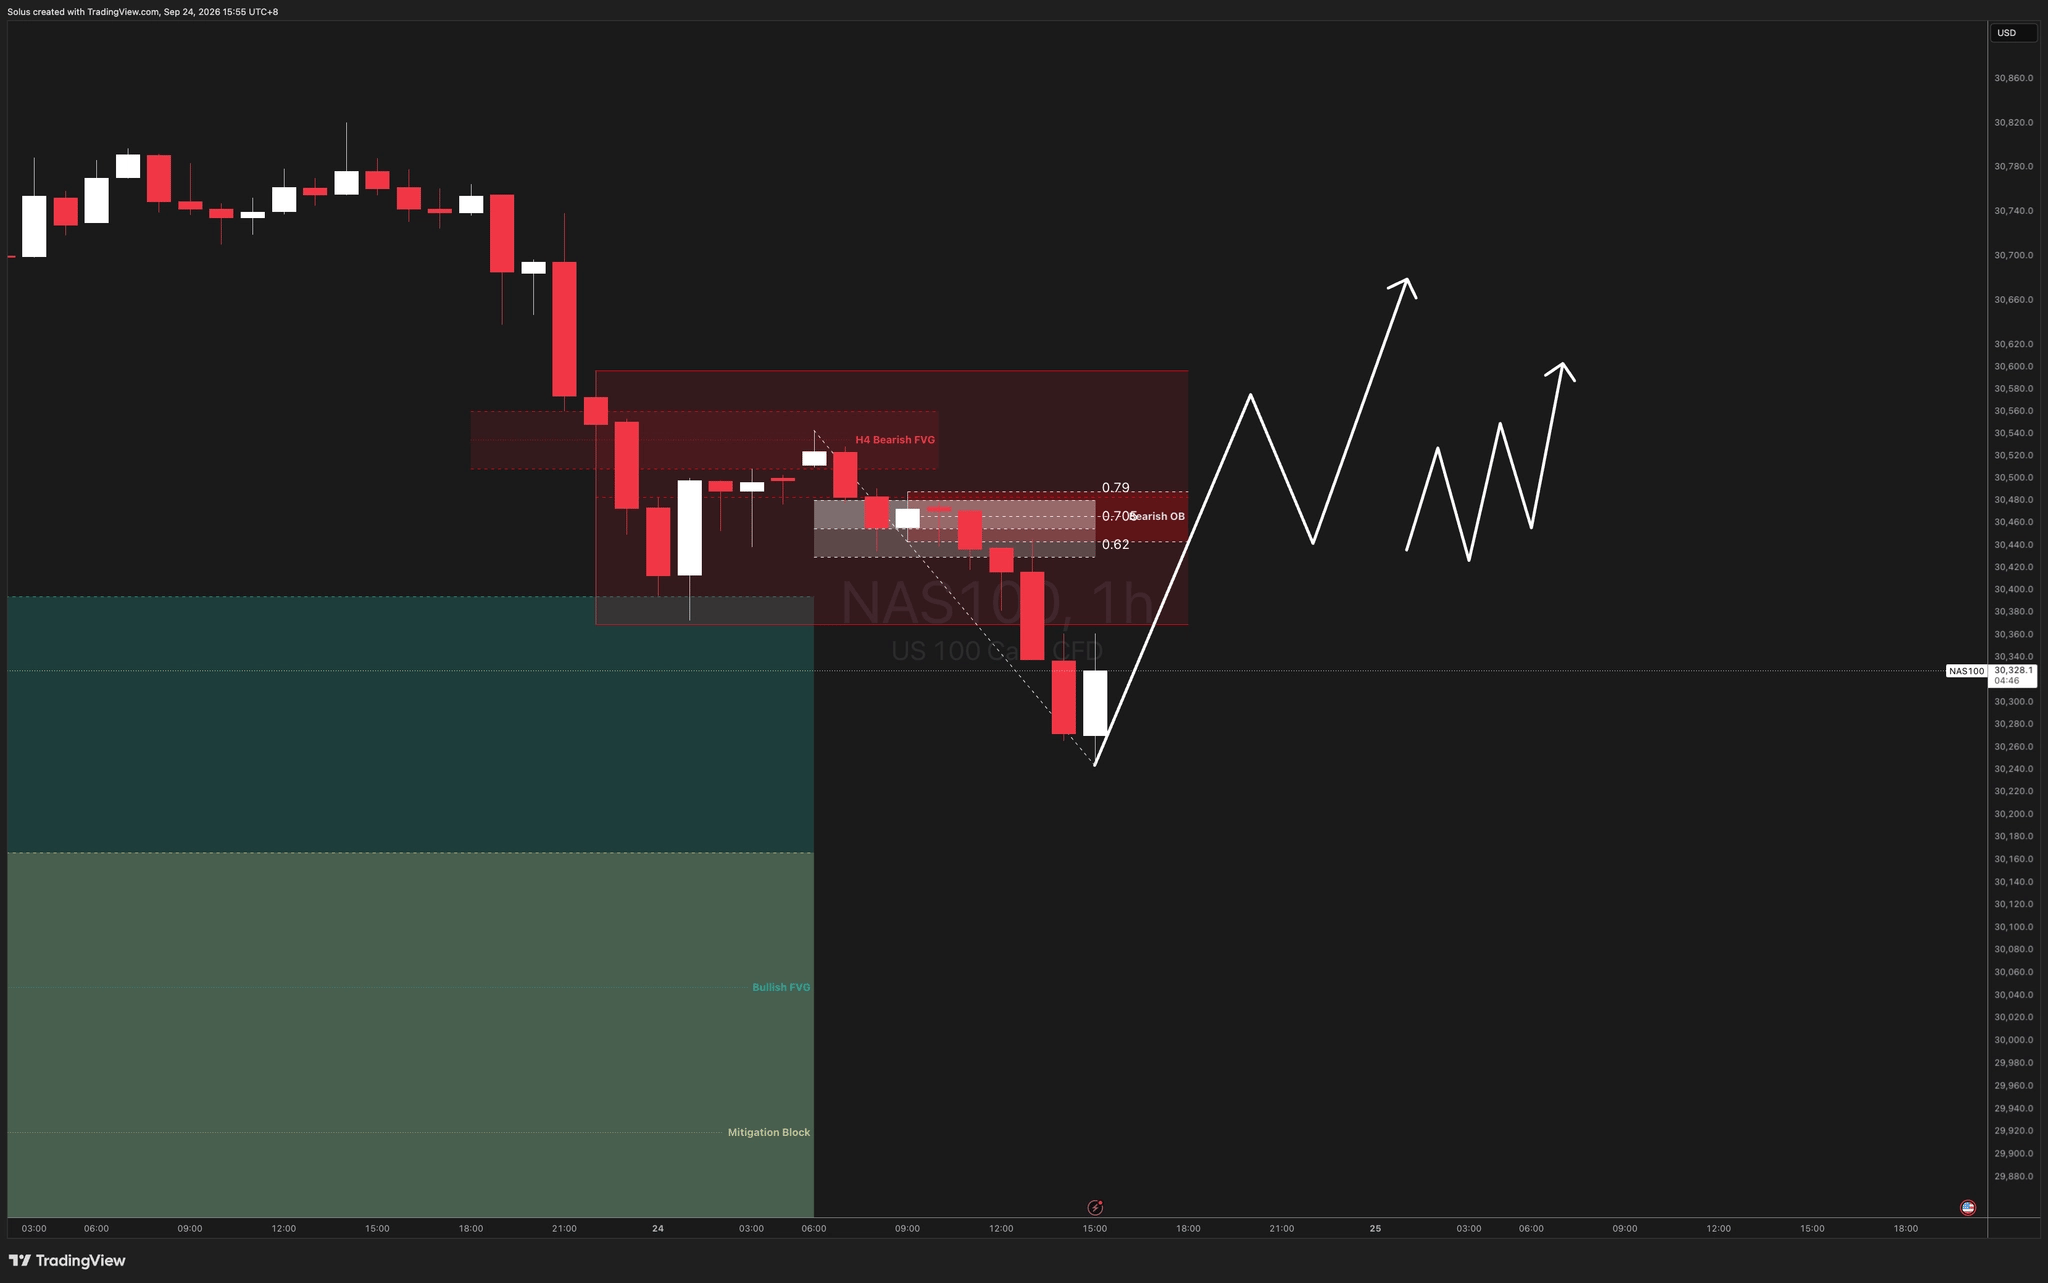
Price rallies into the bigger selling zone, sellers fail to push it back down, and it breaks and holds above. That completes the daily dip and puts the uptrend back in charge. I need yields easing toward 5% for it.
The tell nobody's watching
This isn't just a US bond selloff. Japan's 10-year yield hit a 30-year high on the same night the US 10-year hit a 2007 high. When Japanese yields rise, one of the biggest foreign buyers of Treasuries has less reason to buy them. If the pressure is global, one soft US print won't fix the Nasdaq's rate problem.
Bearish scenario: The bounce fails at one-hour resistance
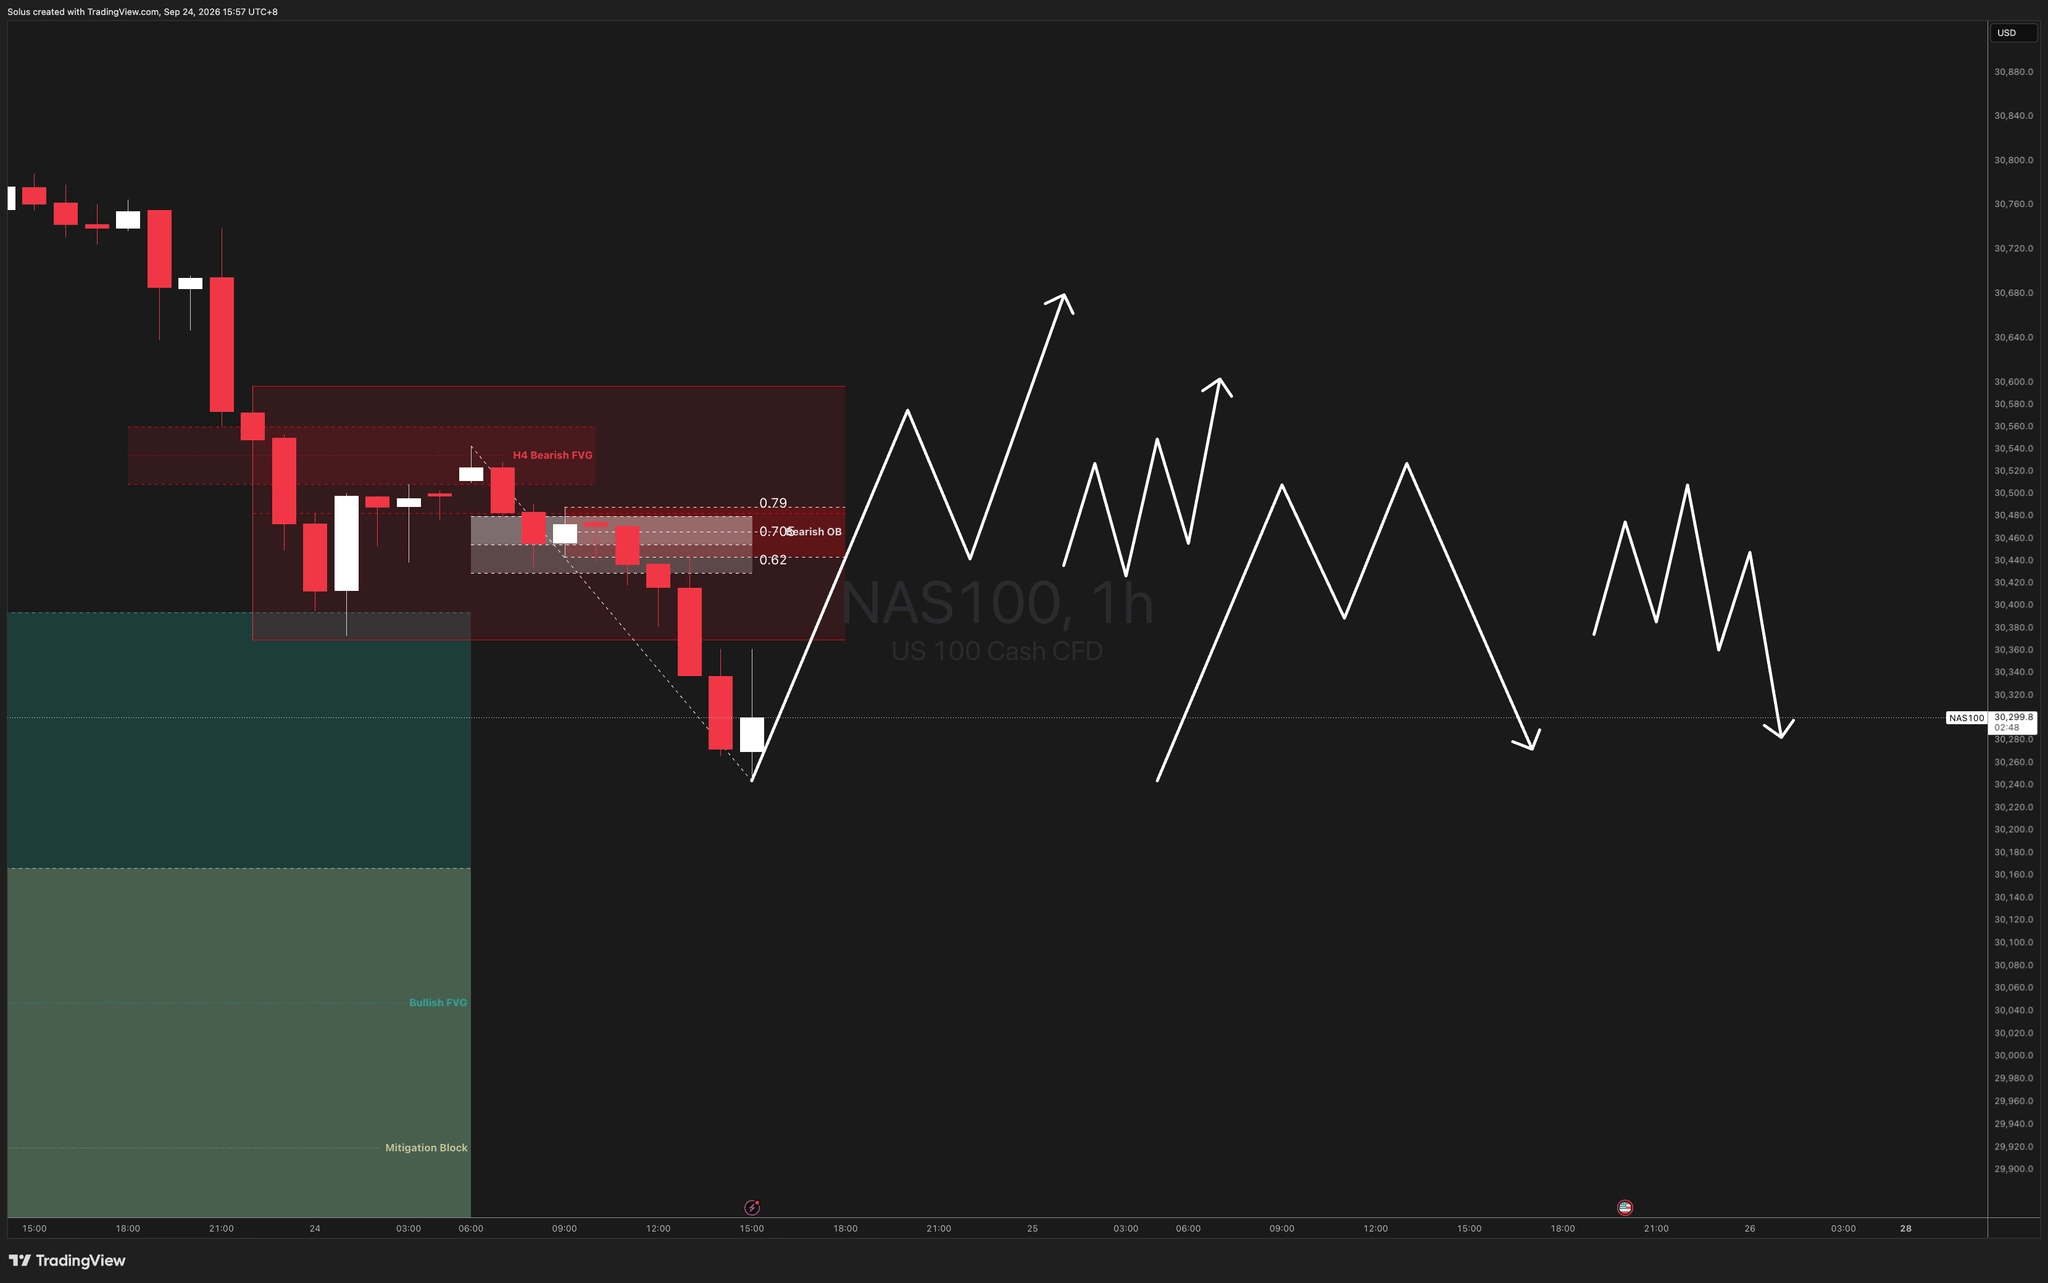
New York bounces into the 1-hour selling zone, pushes briefly above the local high to trap late buyers, then turns back down. With the 10-year above 5.05%, that rejection continues the 4-hour down move toward 30,420, and a break there opens a deeper daily pullback. A second strong red 1-hour candle from current prices would do the same job without the bounce.
How I'm approaching this today
Bias
Bearish for the New York session, inside a daily uptrend. Medium Conviction — structure and macro agree, but price is already near the extended target.
Key takeaways
- Macro: The 10-year is at 5.11% and Japanese yields are at a 30-year high. The rate pressure is global.
- Bias: Bearish for the NY session inside a daily uptrend, medium conviction.
- Levels: The 1-hour selling zone above, 30,420 below; 5.05% on the 10-year and 101 on the dollar index.
- Risk: Price is near yesterday's extended target, so I'm not chasing lows.
Author

Jasper Osita
Independent Analyst
Jasper has been in the markets since 2019 trading currencies, indices and commodities like Gold. His approach in the market is heavily accompanied by technical analysis, trading Smart Money Concepts (SMC) with fundamentals in mind.