Meta platforms (META) soars 100% in less than four months, what’s next? [Video]
![Meta platforms (META) soars 100% in less than four months, what’s next? [Video]](https://editorial.fxstreet.com/images/Markets/Equities/Industries/CommunicationServices/cable-network-man-637435389675652273.jpg)
Meta Platforms, Inc (META) formerly known as Facebook, is the world’s largest social media platform with a portfolio of apps including Instagram and WhatsApp. It measures its user base in daily and monthly active users, with advertising being its main source of revenue. The company faces competition from Google, Twitter, Amazon, and Snapchat-parent Snap, as well as Apple, YouTube, Bytedance, and Tencent. Meta recently changed its name to reflect its focus on the metaverse. META is listed on NASDAQ and is a component of NASDAQ 100 and S&P 500.
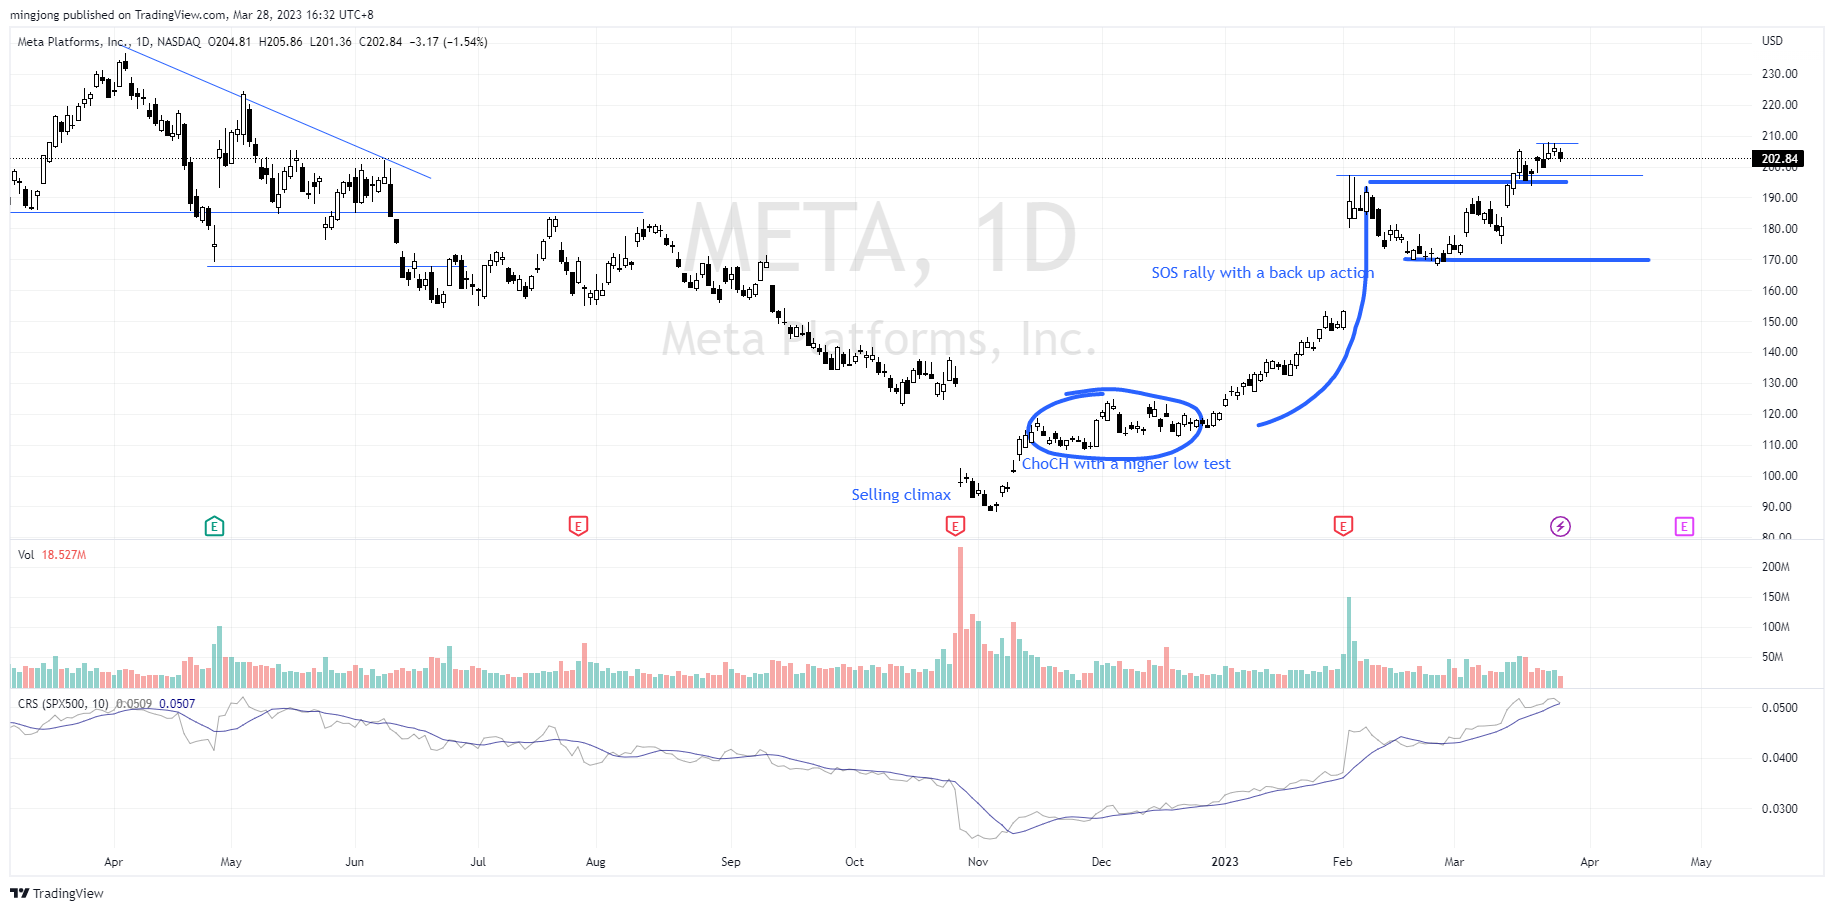
Spot the Wyckoff change of character from the selling climax
META started 2022 with a gap down on 3 Feb. The Wyckoff distribution phase was prolonged and continued for several months until late October. The earning results on 27 Oct triggered another gap down and took the price to around $88. However, this down move was accompanied by a big spike in volume in comparison to previous down swings. This capitulation was considered as stopping volume and was confirmed by the higher low test with decreasing volume.
The price confirmed the $88 level is Wyckoff selling climax (SC) as it rallied to $119 in mid Nov. This rally has the characteristics of a Wyckoff change of character (CHoC) where the down trend was shifted to a trading range. The price tested the $119 resistance on several occasions with relatively low volume compared to late October 2022. This was the sign of supply exhaustion and a rally could be expected.
Subsequently, META started 2023 with a successful breakout from the $119 resistance and a Wyckoff sign of strength (SOS) rally. The rally was steady but reassuringly after successfully breaking out of the trading range. Then the earning results on 2 Feb provided the much needed catalyst for the price to gap up with strong momentum. Nevertheless, the price quickly pulled back from the $197 resistance to form a Wycoff back up (BU) range. The pull back was shallow, about half of the price gap on 2 Feb. Furthermore, there was no threatening volume to suggest the presence of supply. The price also confirmed the bullish momentum with another rally up that successfully stayed above the $197 axis.
META directional bias via Wyckoff method
Bullish. According to the Wyckoff method, META just broke out of BU range between $168 and $197. The shallow retest of $197 on 20 Mar would have been a great entry signal for a long position with the swing low of $187 as stop loss. The price might retest the $197 axis again before challenging the next immediate resistance at $245 and $322 to close the gap of Feb 2022.
If the price breaks below $187, it will likely retest the support at $169 with a prolonged consolidation.
META was discussed in detail in my weekly live group coaching on 28 Mar 2023 before the market opened. Despite the failure scenario shown as discussed in this latest video (refer below), the characteristics of the FOMC bar were not as bearish as anticipated. This could present a trading opportunity for META to ride on its strong bullish momentum.
Author

Ming Jong Tey
Independent Analyst
Ming Jong Tey has been trading since 2008. He started his learning journey from technical analysis (indicators, Fibonacci, etc...) to value investing. Throughout his journey, he develops an interest in price action with chart pattern trading.


