$MARA: Buying opportunity in Marathon Digital Holdings in seven swings

Marathon Digital Holdings Inc. (formerly Marathon Patent Group) is a digital asset technology company. It engages in mining cryptocurrencies, with a focus on the blockchain ecosystem and the generation of digital assets. Founded 2010 and headquartered in Las Vegas, Nevada, US, one can trade it under ticker $MARA at NASDAQ. Currently, we see cryptocurrencies turning for another bullish cycle higher. In fact, the rally in prices of cryptocurrencies should push higher and may even provide a magnifying effect on the share prices of cryptocurrency mining/producing companies. Therefore, Marathon Digital Holdings being one of digital assets producers should become a profitable invetsment target as it should ramp up along with acceleration in cryptocurrencies prices.
In the initial article from May 2023, we were calling for a new bullish cycle. We were right, we have broken the weekly descending channel. Now, we see 5 waves up from December 2022 lows. Clearly, it supports the bullish case. Now, short term correction should find support in 7 swings. Investors and traders should use pullback as next buying opportunity. In the current blog, we explain the wave structure, sequences and short- to long-term targets.
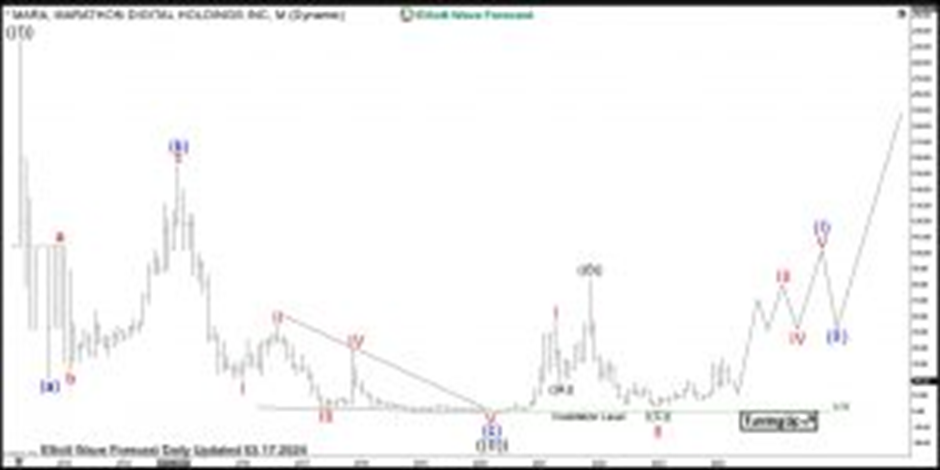
Marathon Digital Monthly Elliott Wave analysis 03.17.2024
The monthly chart below shows the Marathon Digital shares $MARA traded at NASDAQ. First, from the all-time lows, the stock price has developed a cycle higher in black wave ((I)). Hereby, $MARA has printed the all-time highs in March 2012 at 234. From the highs, a correction lower in wave ((II)) has unfolded as a zigzag correction being a 5-3-5 structure. It has found an important bottom in March 2020 at 0.35. As a matter of fact, in 8 years $MARA has lost more than 99% off its peak value.
From the March 2020 lows, another motive cycle in black wave ((III)) has started and is currently in the initial stages. We see already first nest consisting of red waves I-II in place. Now, acceleration higher in red wave III of blue wave (I) should follow. Once all 5 waves of blue wave (I) will be completed, then pullback in blue wave (II) should provide with another opportunity to join the rally. Then, acceleration higher in blue wave (III) of black wave ((III)) should bring prices considerably higher. Long-term, black wave ((III)) should extend towards 234 highs and even beyond.
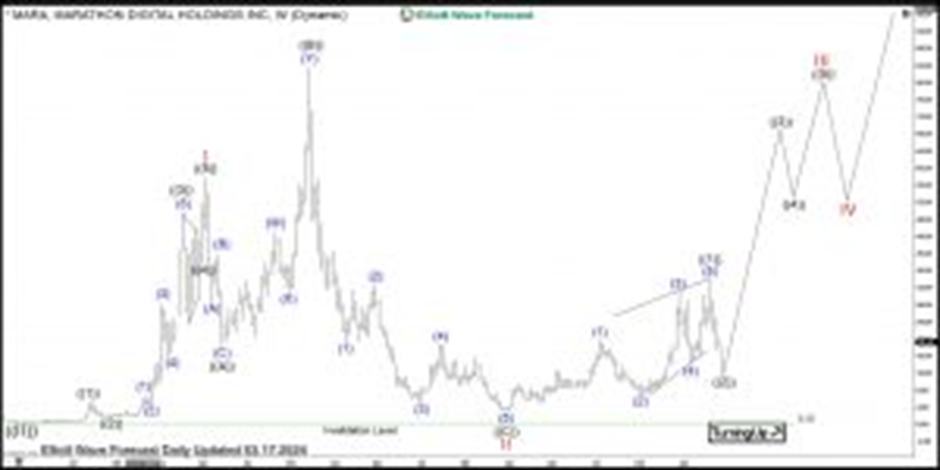
Marathon Digital weekly Elliott Wave analysis 03.17.2024
The Weekly chart below shows in more detail the initial stages of the black wave ((III)). From the March 2020 lows, a bullish cycle in red wave I has unfolded as an impulse. Hereby, black wave ((3)) shows an extension. Red wave I has ended in April 2021 at 57.75. From the highs, the consolidation pattern in red wave II has unfolded as an expanded flat pattern being 3-3-5 structure. First, 3 swings of black ((A)) have found bottom in May 2021 at 18.32. Then, a 7 swings (=3 swings) bounce in black wave ((B)) has set a higher high in November 2021 at 83.45. From there, black wave ((C)) has confirmed expanded flat structure by breaking 18.32 lows. It shows fully developed 5 waves off the highs. In overall, the recent sideways-to-higher price action along with breaking of RSI channel suggest that the new bullish cycle might have started.
It is the preferred view that red wave II has set an important low in December 2022 at 3.11. While above there, a new cycle in red wave III is in progress. The target for red wave III will be towards 60.45-95.94 area and even higher. Current prices below 20$ offer still a great investment opportunity. While medium-term investors can expect 3 times reward on their risk, long-term reward reaches towards 11x and more as related to current engagement.
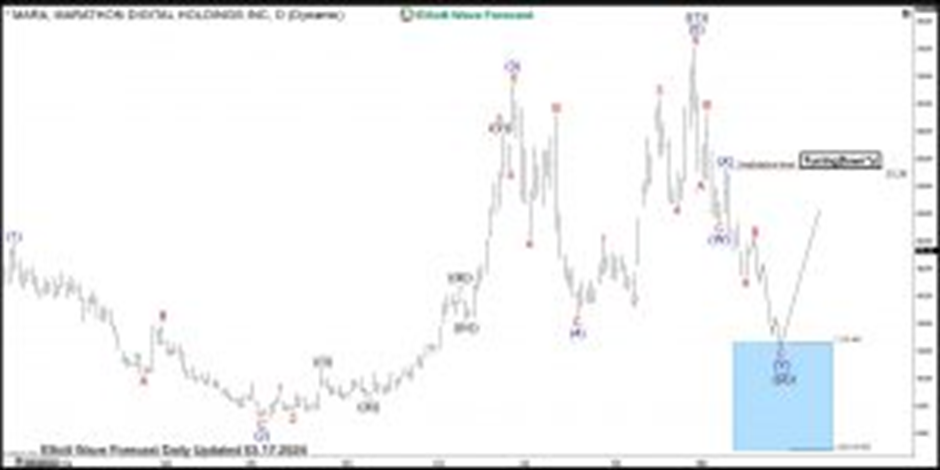
Marathon Digital daily Elliott Wave analysis 03.17.2024
The Daily chart below shows in more detail the initial nest consisting of black waves ((1))-((2)) in progress. From the December 2022 lows, black wave ((1)) of red wave I has ended in February 2024. It has the pattern of a leading diagonal being a 5-3-5-3-5 structure. From the 34.09 highs, correction in wave ((2)) should provide an opportunity for an acceleration higher in black wave ((3)). It unfolds as a double three pattern being 7 swings structure. Firstly, from the February 2024, 3 swings of blue wave (W) have set a low at $21.45 in March 2024. Secondly, a bounce in blue wave (X) has printed a connector high at $25.28. Thirdly, $MARA has broken $21.45 lows opening up bearish sequence. It should reach now in another 3 swings towards 12.62-4.80 area. There, acceleration higher in black wave ((3)) of red wave III should take place.
Investors and traders can be using 12.62-4.80 bluebox area as a buying opportunity in $MARA targeting 35.82-54.98 and higher in short-term and 129.80 and beyond in the long run.
Author

Elliott Wave Forecast Team
ElliottWave-Forecast.com