Is the US stock market bull run running out of steam? Historical patterns signal possible endgame
The US stock market Bull run could be heading to its final lap, as indicated in the attached chart of the US30, US 500, and US 100.
The US stock market bull run: Is it approaching its final lap?
The US stock market's multi-year Bull run could be nearing its end, as patterns across the US30, US500, and US100 indicate. An analysis of their price action highlights notable similarities and critical patterns that warrant close attention. The charts attached provide insights into these dynamics, focusing on price trends and key levels that may signal a turning point.
US30 analysis
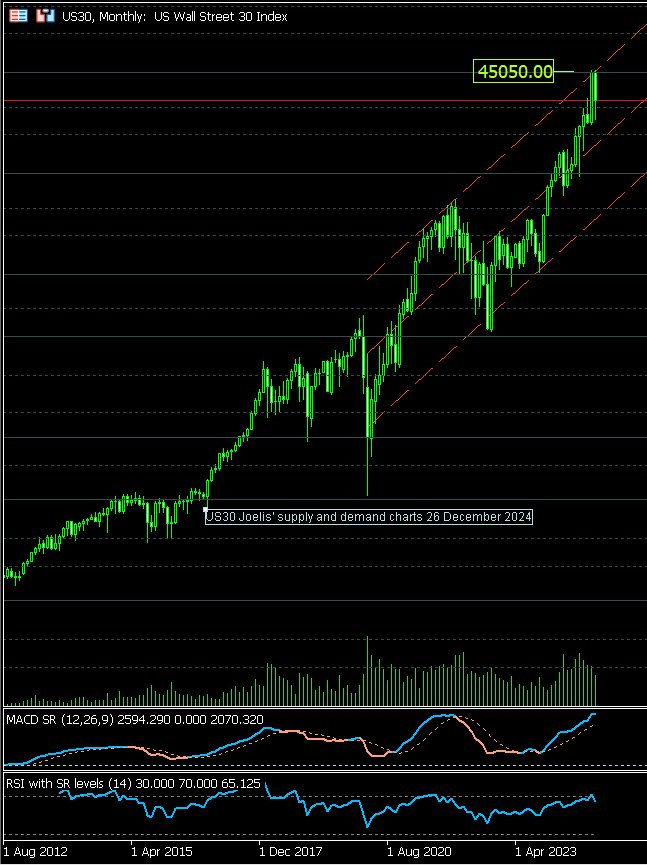
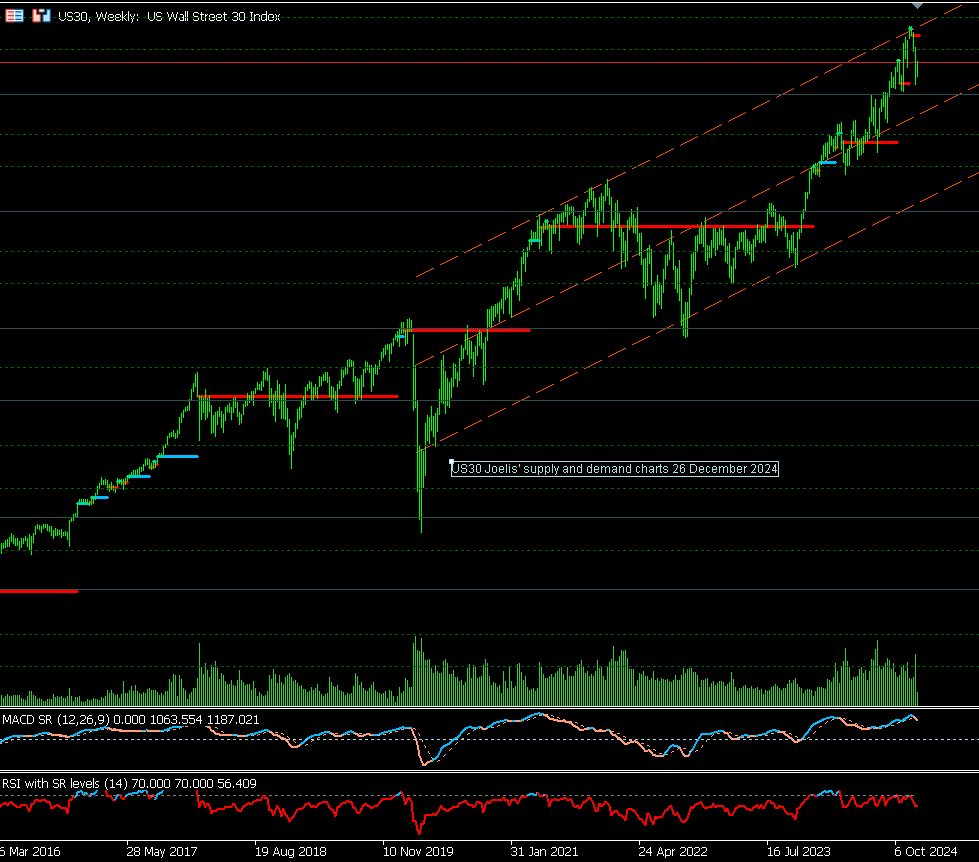
The recent decline of the US30 is pivotal in understanding the broader market context. The index attempted to test its long-term four-year monthly price channel from 2020 to the present. This attempt, visible across multiple timeframes—daily, weekly, and monthly—resulted in a failed push to the top of the price channel, leading to a drop of more than 6%. Subsequently, the US30 has recovered approximately 3% but is now encountering resistance around 43,180, as depicted in the daily chart.
Historical patterns and critical levels
A crucial observation in the daily chart is the similarity to the price action in 2022. During that period, the US30 experienced a significant correction of over 20% before launching into a two-year Bull run. The question arises: "Is history about to repeat itself, or is this time different?" Investors must monitor critical levels across multiple timeframes to capitalize on potential opportunities.
US 30 monthly chart
US 30 weekly chart
US 30 daily chart

US500 analysis
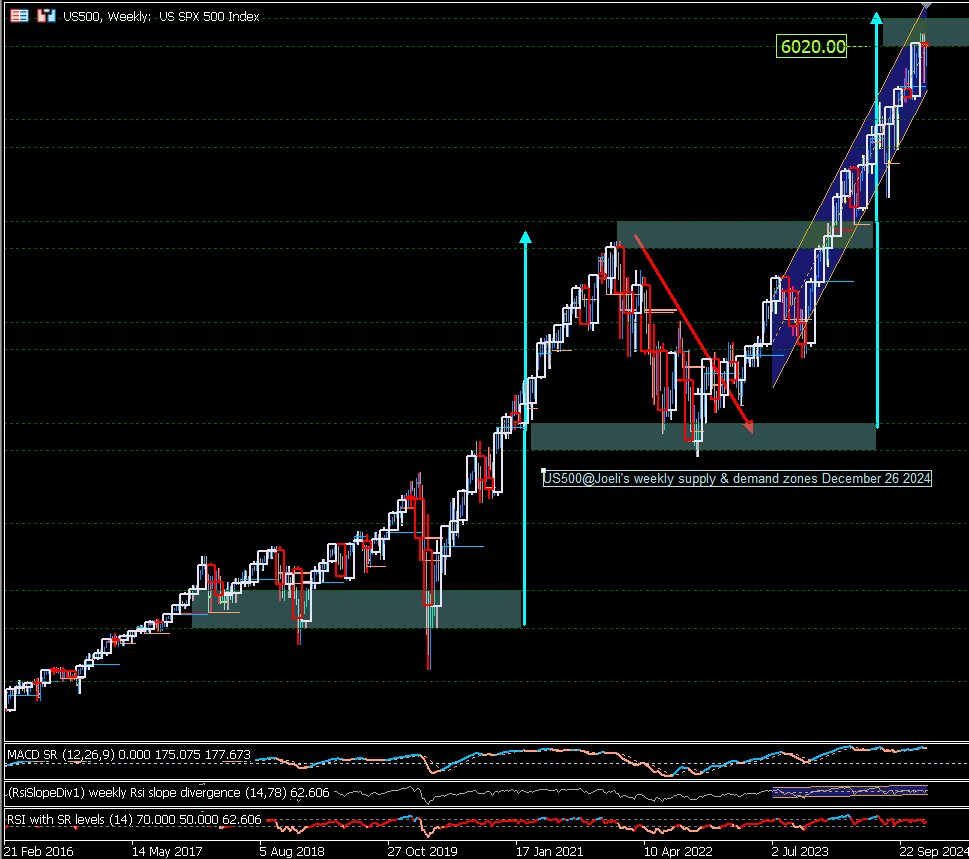
The US500 mirrors the price patterns seen in the US30. The attached weekly chart highlights a ten-month correction, culminating in a drop exceeding 20%. This was followed by the ongoing two-year Bull run. The current price cycle bears striking similarities to the 2020–2022 period, reinforcing the notion of historical repetition.
Indicators of cycle completion
If the observed cycles are consistent, we might be approaching the final phase of the two-year Bull run. Key levels must be carefully observed for signs of reversal or continuation.
US 500 weekly chart
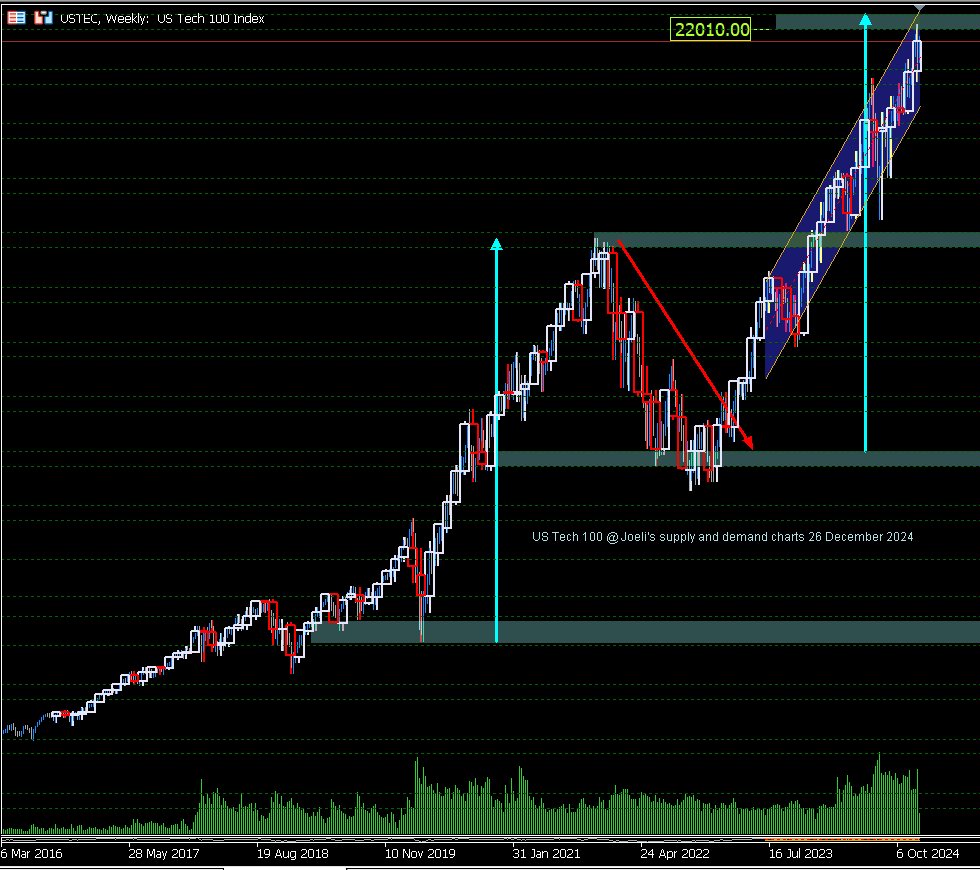
US100 analysis
The US Tech 100 exhibits comparable price behavior to the US30 and US500. As shown in the attached weekly chart, the two-year Bull run from 2020 to 2022, a correction of over 30% in 2022, and the subsequent rally since then closely align with the patterns in the other indices.
Outlook and key levels
Notably, the US100 projects a strong upward trajectory on the monthly chart. Provided the price remains above the critical support level of 21,487, it is anticipated to retest 22,010 by the end of 2024. Breaking or holding these levels will play a crucial role in determining the cycle's next phase.
US Tech 100 weekly chart
Conclusion
The patterns observed across the US30, US500, and US100 underscore striking similarities in their price action and cyclical behaviour. Each index reflects critical moments of correction and Bull runs, aligning with historical cycles. As we approach what could be the final lap of the current Bull run, traders and investors are encouraged to:
-
Monitor Key Levels: Pay attention to resistance and support zones, particularly the US30's 43,180 level and the US100's critical levels.
-
Analyze Multi-Timeframe Trends: Patterns in daily, weekly, and monthly charts provide valuable insights into potential reversals or continuations.
-
Adapt Strategies: Be prepared to seize opportunities by aligning with broader market trends and leveraging insights from historical repetitions.
History may not always repeat itself exactly, but its rhythms can offer guidance. As such, vigilance remains paramount in navigating this potentially critical phase of the US stock market.
Author

Denis Joeli Fatiaki
Independent Analyst
Denis Joeli Fatiaki possesses over a decade of extensive experience as a multi-asset trader and Market Strategist.


