|premium|

Invesco CurrencyShares ($FXF Stock): All eyes on 70.95 area for a move higher

Firstly there is data back to when the ETF fund began in 2006 as low as 78.43. Data correlated in the USDCHF foreign exchange pair suggests the FXF high in August 2011 is also the lows of a cycle lower from the all-time in the USDCHF. In this instrument, there is data available back to 1971 when the exchange rate was 4.3180.

The FXF instrument reflects the price swings of the currency pretty well since inception and as previously mentioned the instrument made a high in August 2011. This is where the analysis begins on the monthly chart shown below. The correction from those highs appears to be an Elliott Wave double three structure. The analysis continues below the monthly chart.

FXF

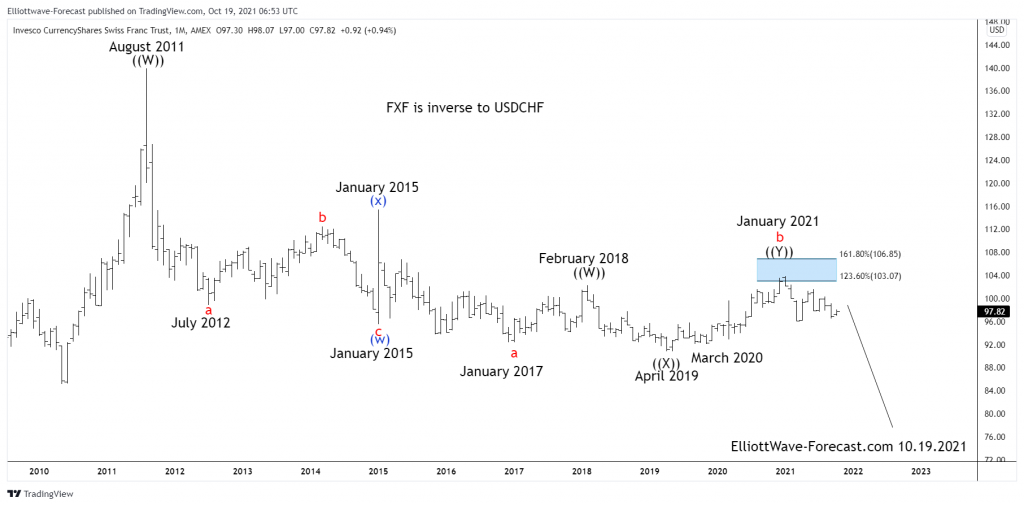
Secondly, as earlier mentioned the decline from the August 2011 highs appears to be an Elliott Wave double three structure. In the second swing of a double three Elliott Wave structure, it generally will reach a price where it is equal to the first swing. When a cycle ends it will show in momentum indicators usually before price makes it obvious. These cycle highs and lows are in the blue color as shown on the chart above (w)-(x). The correction of the January 2015 cycle ended January 2021 in wave b (red). While a bounce remains below where it can see the 70.95 area before a larger bounce higher.

I will mention how this target area is lower is obtained in conclusion. Take a Fibonacci extension tool on your chart platform. Beginning at the August 2011 highs as point 1, trace down to the January 2015 lows where the blue (w) is for point 2. Now trace back up to January 2015 blue wave (x) highs for point 3. This will give the equal legs area for (y) (not shown) at 70.95. 

Premium

You have reached your limit of 3 free articles for this month.

Start your subscription and get access to all our original articles.

Subscribe to PremiumSign In

Author

Elliott Wave Forecast Team

Elliott Wave Forecast Team

ElliottWave-Forecast.com

More from Elliott Wave Forecast Team
Share:

Editor's Picks

EUR/USD appears supported by the 200-day SMA, for now

Following an early pullback to multi-week lows near 1.1670, EUR/USD now manages to reclaim the 1.1700 region as the NA session draws to a close on Monday. The steep retracement in spot follows the equally strong move higher in the US Dollar, as investors continue to assess the geopolitical landscape in the wake of the US and Israel attacks on Iran.


GBP/USD hits new yearly lows near 1.3300

GBP/USD adds to the recent bearish tone, approaching to the key 1.3300 support to reach fresh YTD troughs against the backdrop of the robust performance of the US Dollar. Indeed, Cable’s decline comes amid the firm demand for the safe-haven space in the wake of the US and Israel attacks to Iran.

Gold eases some ground, approaches $5,300

Gold now surrenders part of the earlier advance, reshifting its attenton to the $5,300 zone per troy ounce at the beginning of the week. Indeed, the yellow metal’s firm performance appears propped up by incresing geopolitical jitters in the Middle East, which at the same time fuels the demand for the safe-haven space.

Strategy lifts holdings to 3.4% of Bitcoin's total supply amid inflows into crypto products

Strategy continued its accumulation of the top crypto last week, acquiring 3,015 BTC for $204 million amid renewed interest in crypto products after four weeks of outflows.

The Fed is finally talking about AI – Here's why it matters for the US Dollar

AI is moving from earnings calls into the heart of monetary policy discussions, forcing Federal Reserve officials to confront a new question: How to act if AI reshapes inflation, employment and interest rates at the same time?

Grass 20% bullish breakout defies broader market weakness

Grass (GRASS) is edging up above $0.30 at the time of writing on Monday. The token’s notable 20% intraday surge stands out amid heightened volatility in the broader crypto market.