|

International Business Machine Corp (IBM): Showing a bullish sequence and looking for a $400.00 target [Video]

IBM, or International Business Machine Corporation, is a multinational technology company headquartered in Armonk, New York. IBM operates in over 175 countries and offers a wide range of products and services, including cloud computing, artificial intelligence, computer hardware, and software. The company is also a leader in quantum computing and has made significant advancements in this field. This article and video look at the Elliott Wave outlook of the IBM.

IBM quarterly Elliott Wave chart

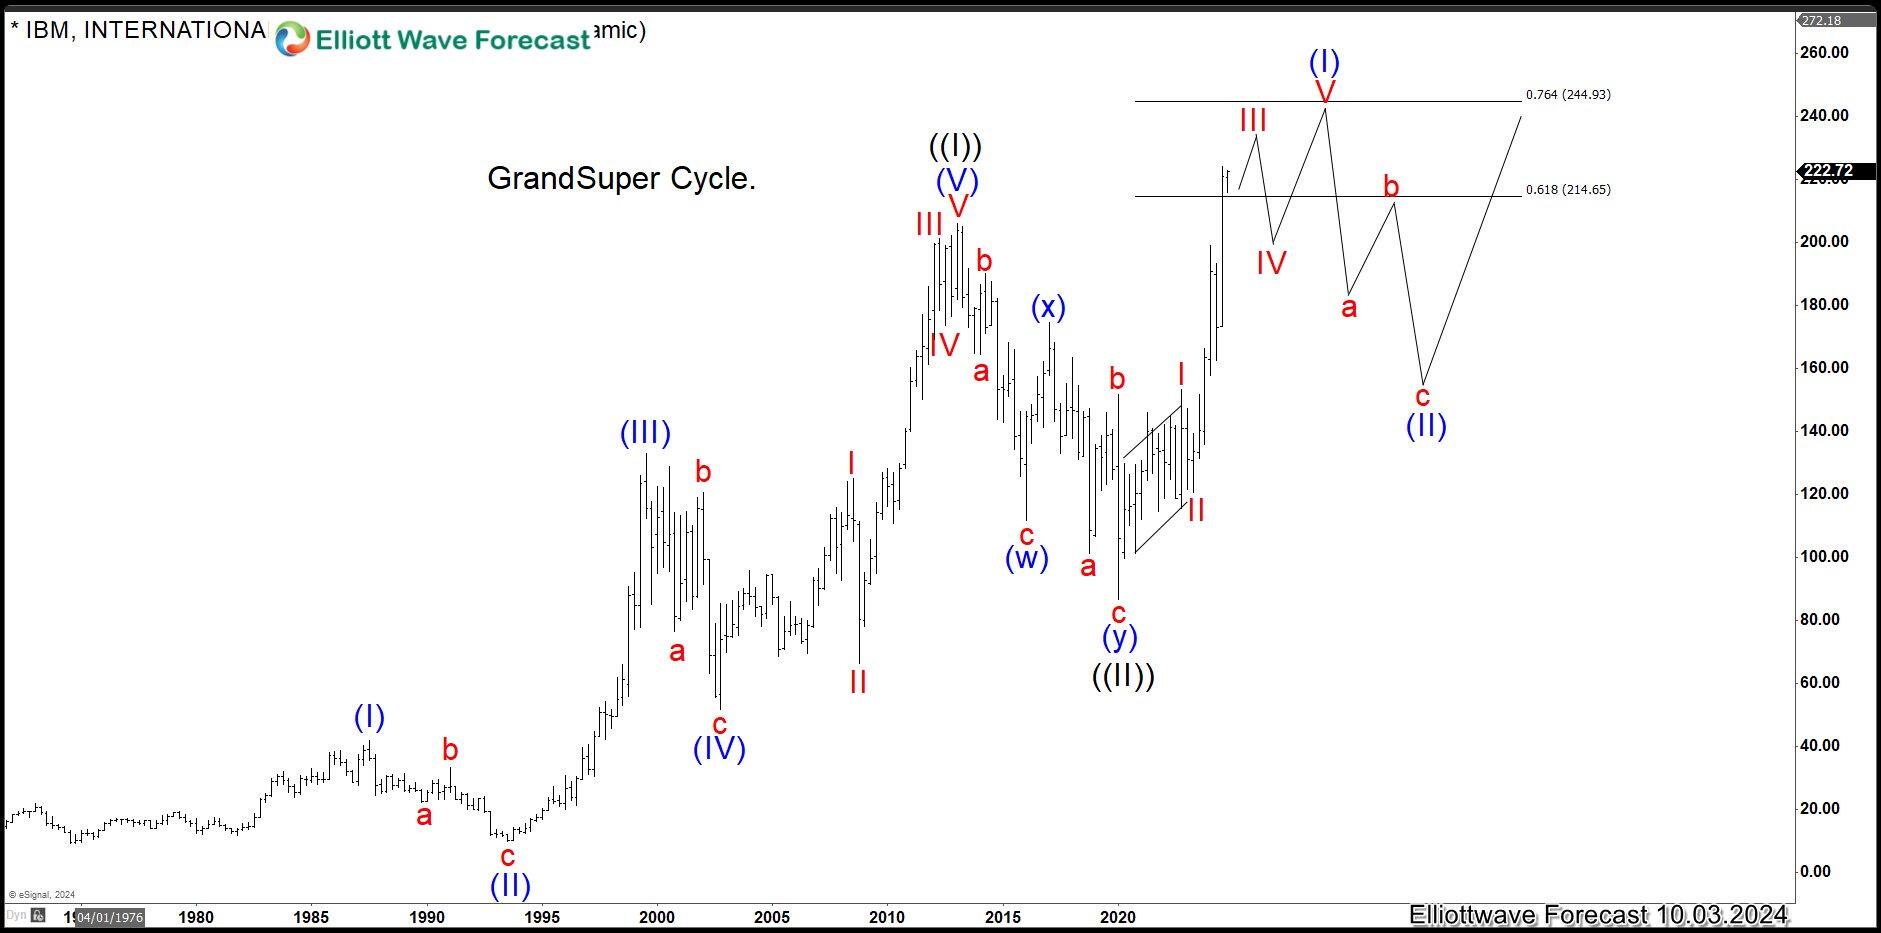
Quarterly Elliott Wave Chart of IBM above shows the stock formed a bullish sequence. It has broken above wave ((I)) peak, confirming the bullish sequence. Rally to 206.22 ended wave ((I)) in grand super cycle. Down from there, wave (w) ended at 111.66 and wave (x) rally ended at 174.59. Wave (y) lower ended at 86.50 which completed wave ((II)) in higher degree. The stock has resumed higher in wave ((III)) and should continue to extend higher.

International Business Machine (IBM) weekly Elliott Wave chart

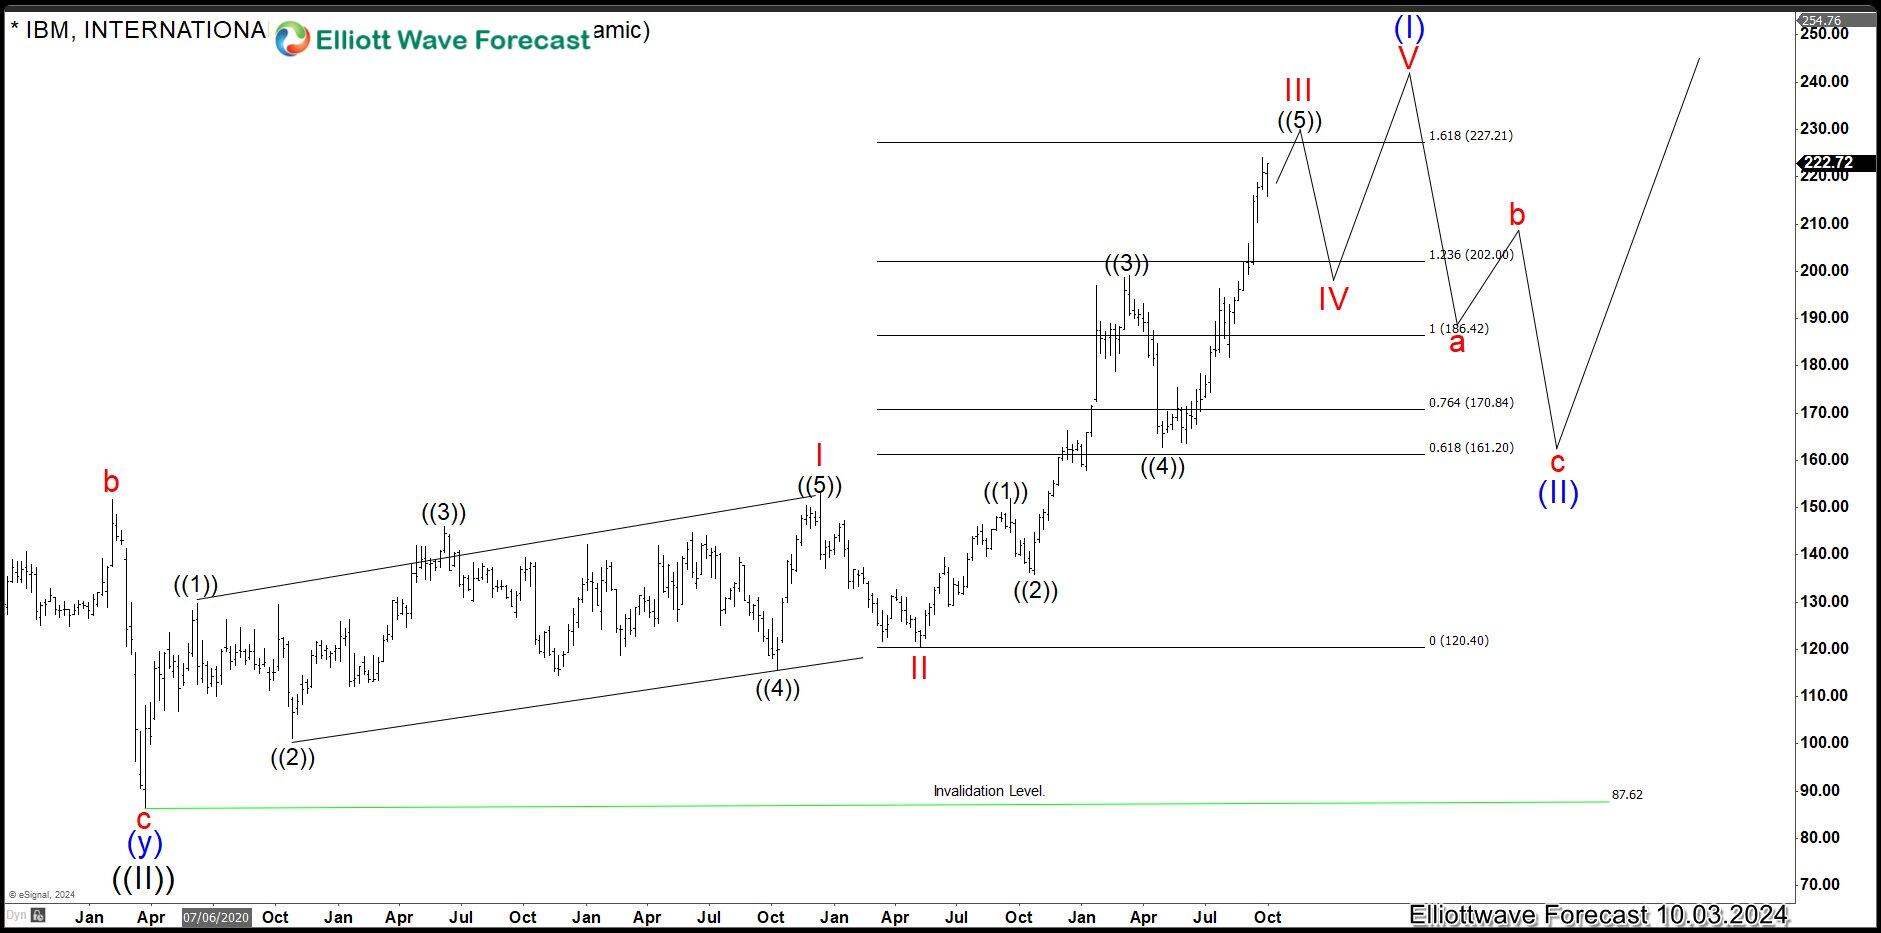
Weekly Elliott Wave View on IBM above shows wave ((II)) pullback ended at 87.62. Up from there, wave I ended at 153.21 and pullback in wave II ended at 120.55. Expect the stock to complete wave III soon, then it should pullback in wave IV before it resumes higher again in wave V to complete wave (I). While above 87.62, expect dips to find support in 3, 7, 11 swing for further upside.

IBM Elliott Wave [Video]

Author

Elliott Wave Forecast Team

Elliott Wave Forecast Team

ElliottWave-Forecast.com

More from Elliott Wave Forecast Team
Share:

Markets move fast. We move first.

Orange Juice Newsletter brings you expert driven insights - not headlines. Every day on your inbox.

By subscribing you agree to our Terms and conditions.

Editor's Picks

EUR/USD climbs toward 1.1800 on broad USD weakness

EUR/USD gathers bullish momentum and advances toward 1.1800 in the second half of the day on Tuesday. The US Dollar weakens and helps the pair stretch higher after the employment report showed that Nonfarm Payrolls declined by 105,000 in October before rising by 64,000 in November.

GBP/USD climbs to fresh two-month high above 1.3400

GBP/USD gains traction in the American session and trades at its highest level since mid-October above 1.3430. The British Pound benefits from upbeat PMI data, while the US Dollar struggles to find demand following the mixed employment figures and weaker-than-forecast PMI prints, allowing the pair to march north.

Gold extends its consolidative phase around $4,300

Gold trades in positive above $4,300 after spending the first half of the day under bearish pressure. XAU/USD capitalizes on renewed USD weakness after the jobs report showed that the Unemployment Rate climbed to 4.6% in November and the PMI data revealed a loss of growth momentum in the private sector in December. 

US Retail Sales virtually unchanged at $732.6 billion in October

Retail Sales in the United States were virtually unchanged at $732.6 billion in October, the US Census Bureau reported on Tuesday. This print followed the 0.1% increase (revised from 0.3%) recorded in September and came in below the market expectation of +0.1%.

Ukraine-Russia in the spotlight once again

Since the start of the week, gold’s price has moved lower, but has yet to erase the gains made last week. In today’s report we intend to focus on the newest round of peace talks between Russia and Ukraine, whilst noting the release of the US Employment data later on day and end our report with an update in regards to the tensions brewing in Venezuela.

BNB Price Forecast: BNB slips below $855 as bearish on-chain signals and momentum indicators turn negative

BNB, formerly known as Binance Coin, continues to trade down around $855 at the time of writing on Tuesday, after a slight decline the previous day. Bearish sentiment further strengthens as BNB’s on-chain and derivatives data show rising retail activity.