India’s Q1 Gross Domestic Product expands beyond expectations: What it means for Indian Rupee

India’s Q1 Gross Domestic Product (GDP) data rises at a steady pace of 7.8% Year-on-Year (YoY), faster than estimates of 7.2%.
There seems to be further appreciation in the Indian Rupee (INR) against the US Dollar (USD) following the release of the better-than-projected India’s Q1 GDP data. The Indian currency has been outperforming after the RBI's monetary policy announcement
The table below shows the percentage change of Indian Rupee (INR) against listed major currencies today. Indian Rupee was the strongest against the Japanese Yen.
| USD | EUR | GBP | JPY | CAD | AUD | INR | CHF | |
|---|---|---|---|---|---|---|---|---|
| USD | -0.26% | -0.37% | -0.06% | -0.24% | -0.08% | -0.69% | -0.26% | |
| EUR | 0.26% | -0.12% | 0.20% | 0.01% | 0.17% | -0.61% | 0.00% | |
| GBP | 0.37% | 0.12% | 0.32% | 0.11% | 0.28% | -0.33% | 0.11% | |
| JPY | 0.06% | -0.20% | -0.32% | -0.18% | -0.02% | -0.82% | -0.20% | |
| CAD | 0.24% | -0.01% | -0.11% | 0.18% | 0.15% | -0.63% | -0.02% | |
| AUD | 0.08% | -0.17% | -0.28% | 0.02% | -0.15% | -0.79% | -0.19% | |
| INR | 0.69% | 0.61% | 0.33% | 0.82% | 0.63% | 0.79% | 0.62% | |
| CHF | 0.26% | -0.00% | -0.11% | 0.20% | 0.02% | 0.19% | -0.62% |
The heat map shows percentage changes of major currencies against each other. The base currency is picked from the left column, while the quote currency is picked from the top row. For example, if you pick the Indian Rupee from the left column and move along the horizontal line to the US Dollar, the percentage change displayed in the box will represent INR (base)/USD (quote).
What do Gross Domestic Product data mean for the Indian Rupee?
India’s GDP data carries a significant impact on the Indian Rupee, given that the Indian economy is a developing country. However, this time it’s different!
The impact of the India’s GDP data is expected to be limited on the Indian Rupee, as Reserve Bank of India (RBI) has downgraded the growth outlook due to energy supply shock in the monetary policy announcement earlier in the day. India’s central bank sees Financial Year (FY) 2026-27 GDP growth at to 6.6%, revised lower from 6.9% previously anticipated.
In the policy meeting, the RBI left the Repo Rate steady at 5.25%, as expected, and warned of high inflation.
Technical Analysis: USD/INR falls below 20-day EMA
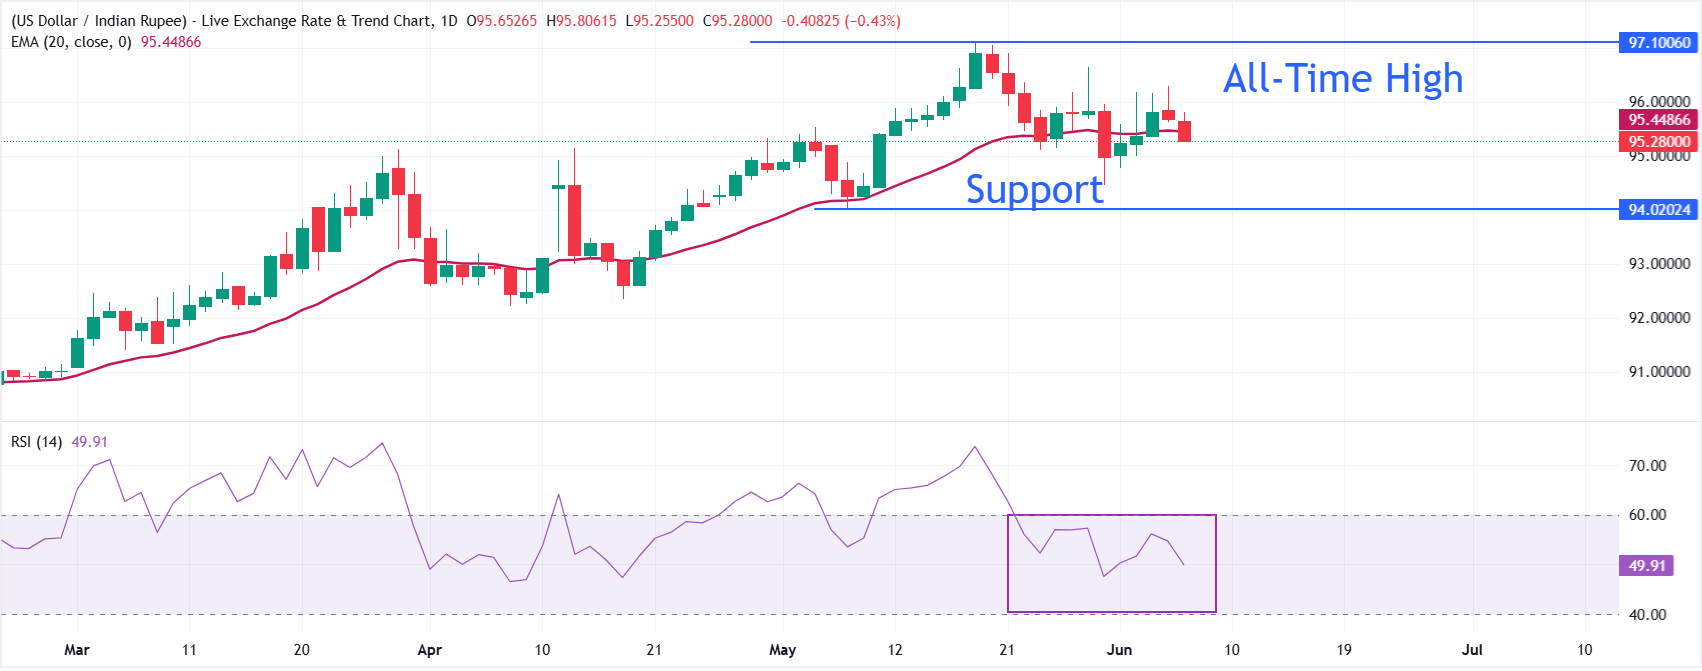
USD/INR trades sharply lower at around 94.9500, holding a bearish near-term bias as spot remains under the 20-day Exponential Moving Average (EMA) at 95.41. The pair has retreated from recent highs, and the inability to reclaim this dynamic barrier suggests rallies are likely to be sold while the price holds beneath it.
The Relative Strength Index (14) has slipped to near 50, hinting at waning upside momentum rather than outright oversold conditions.
On the topside, initial resistance is located at the 20-day EMA around 95.42, and a daily close above this level would be needed to ease immediate downside pressure and open a path toward 96.00. Looking down, the pair could slide to the May 7 low near $94.00.
(The technical analysis of this story was written with the help of an AI tool.)
Economic Indicator
Gross Domestic Product Quarterly (YoY)
The Gross Domestic Product released by the Ministry of Statistics is a measure of the total value of all goods and services produced by India. The GDP is considered as a broad measure of Indian economic activity and health. Generally speaking, a high reading is seen as positive (or bullish) for the Rupee, while a falling trend is seen as negative (or bearish).
Read more.Author

Sagar Dua
FXStreet
Sagar Dua is associated with the financial markets from his college days. Along with pursuing post-graduation in Commerce in 2014, he started his markets training with chart analysis.


