Indian Rupee falls as oil prices extend rally, India-US CPI data awaited
- The Indian Rupee falls further against the US Dollar as oil prices extend the advance.
- US President Trump demands reparations for the war, as Iran did the same.
- Investors await the CPI data for July from both India and the US.

The Indian Rupee (INR) opens on a cautious note against the US Dollar (USD) on Tuesday. The USD/INR pair rises further to near 95.40 as surging oil prices due to escalating fears of a prolonged global supply disruption have weakened the Indian currency.
As of writing, the MCX Crude Oil contract expiring on August 19 trades 3.3% higher to near Rs. 8,060, the highest level seen in over a week.
Currencies from economies, such as India, which rely heavily on oil imports to meet their energy needs, tend to underperform in a high-oil-price environment.
Trump also demands compensation for war damages
On Monday, United States (US) President Donald Trump also demanded compensation for war casualties in the Middle East from Iran, through a post on Truth Social, in a direct answer to Iran's own call for compensation, as a key condition for reopening the Strait of Hormuz, a vital passage to almost one-fifth of global energy supply.
US President Trump added that Iran should be held "responsible for the damages and death" caused to the people of Lebanon, Syria, Yemen and Gaza.
Over the weekend, Iran’s Mohammad Bagher Zolghadr, secretary of the council, set out six conditions for the Hormuz reopening.
Both sides demanding compensation for war damages have heightened uncertainty over the truce in the near term, boosting oil prices.
India-US CPI data in focus
This week, the major trigger for the Indian Rupee and the US Dollar will be respective Consumer Price Index (CPI) data for July from their economies, which will be released on Wednesday.
India inflation holds steady as DBS flags mixed food trends and benign core
Economists at DBS Group Research note that key “inflation and trade numbers are due in the second week of August,” with “headline inflation in July… largely steady at 4.4% YoY vs June.” They point out that “high frequency data on food staples point to a rise in pulses, sugar, milk and edible oils, while vegetables have stabilized,” adding that “a catch-up in rainfall in July has helped boost sowing activity.” On the price side, DBS highlights that “adjustments in domestic retail fuel products (non-subsidized LPG was up 10% YoY in July) are also likely to reflect in the utilities and fuel segments.” Even so, they expect underlying pressures to remain contained, with “core readings… benign at sub-4% in July, helped also by moderation in precious metals in the period.”
In the US, both headline and core CPI are expected to have cooled dow, with figures seen arriving lower at 3.4% and 2.5% Year-on-Year (YoY), respectively.
Signs of US inflationary pressures cooling down would ease fears of Federal Reserve (Fed) interest rate hikes further. This week, financial markets have rolled back hawkish Fed after the release of the US Nonfarm Payrolls (NFP) data for July, which showed a reduction in the overall labor force against estimates of a fresh addition of 80K workers.
Fitch affirms India at 'BBB-'; outlook stable
Leading credit-rating firm Fitch has asserted a 'BBB-' rating for the Indian economy, affirming a stable outlook despite Middle East tensions.
Key takeaways from report:
India's rating reflects its robust growth outlook and solid external finance fundamentals.
India's economy remains strong, despite headwinds from energy shock.
There are residual risks from US-Iran conflict but we do not expect durable risk to growth prospects.
Technical Analysis: USD/INR remains supported by 60-day EMA
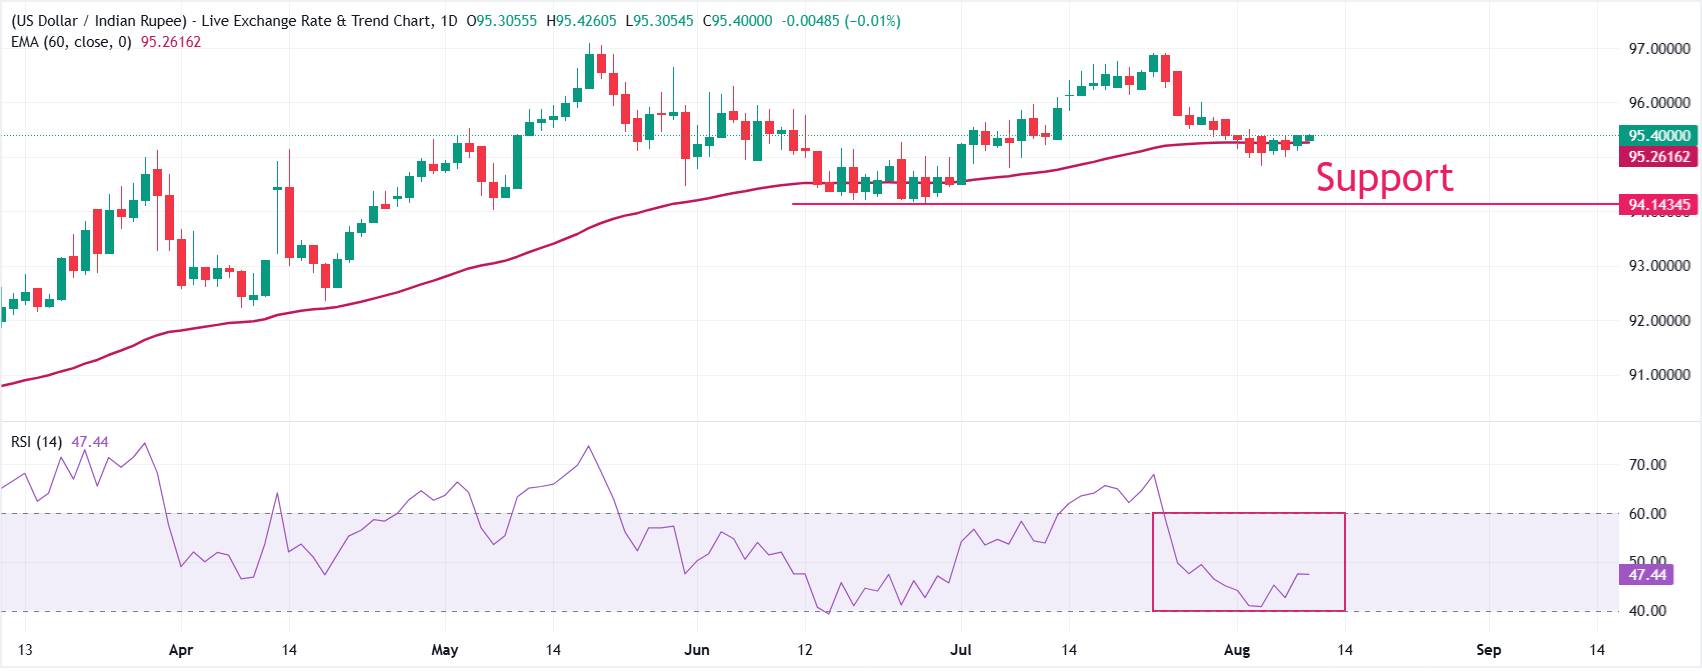
In the daily chart, USD/INR trades at 95.40. The pair holds above the 60-day exponential moving average (EMA) at 95.26, keeping a modest bullish near-term bias as price respects this dynamic support zone.
Momentum is less conclusive, with the 14-day Relative Strength Index (RSI) hovering near 47, hinting at a consolidative tone rather than strong directional conviction, but the preservation of levels above the EMA favors mild upside while this floor holds.
On the downside, initial support is seen at the 60-day EMA at 95.26, followed by the June 26 low at 94.15. Looking up, the pair might attempt to revisit the all-time high at 97.10 if it manages a decisive recovery above 96.00.
(The technical analysis of this story was written with the help of an AI tool. Know more.)
Economic Indicator
Consumer Price Index (YoY)
The India Consumer Price Index released by the Ministry of Statistics and Programme Implementation measures the average price change for all goods and services purchased by households for consumption purposes. CPI is the main indicator to measure inflation and changes in purchasing trends. A high reading is positive (or bullish) for the INR, while a low reading is negative (or bearish).
Read more.Next release: Wed Aug 12, 2026 10:30
Frequency: Monthly
Consensus: 4.5%
Previous: 4.38%
Author

Sagar Dua
FXStreet
Sagar Dua is associated with the financial markets from his college days. Along with pursuing post-graduation in Commerce in 2014, he started his markets training with chart analysis.