How the mACD reveals the market maker's liquidity cycles [Video]
![How the mACD reveals the market maker's liquidity cycles [Video]](https://editorial.fxsstatic.com/images/i/SP500-bearish-withoutbear.jpg)
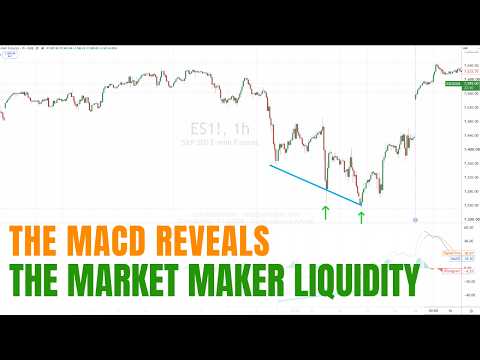
The MACD is probably the most taught and least understood indicator in technical analysis. Most traders use it for the same thing: wait for the signal line cross and enter. But the MACD isn't an entry indicator — it's a reader of institutional liquidity. And read that way, it reveals something no conventional tutorial teaches: the exact cycles of the Market Maker.
In this breakdown, I walk through the full concept and apply it across three markets: S&P futures, EUR/USD, and gold.
The core concept: the MACD measures liquidity withdrawal
To understand why the MACD works as an institutional reader, you first need to understand how the Big Guy manages liquidity.
Price has two sides: the bid and the ask. When the Market Maker wants price to fall, he withdraws the passive liquidity from the bid side. With no institutional buyers absorbing the selling, price drops hard and fast.
That's where the MACD comes in. The greater the distance between the zero line and the extreme of the MACD line, the greater the liquidity withdrawal. It's not an abstract measure of momentum — it's a direct measure of how much liquidity the Big Guy has pulled from the order book.
That withdrawal serves two concrete purposes. First, to take out the stops of traders positioned in the opposite direction. Second, to offer the worst possible price to whoever wants to trade in that direction, and trap them.
Divergence: when the liquidity returns
There comes a moment when price reaches a new low, but the MACD doesn't follow — it fails to make a correspondingly deeper low. That's the classic divergence concept taught in the first days of technical analysis.
But what almost nobody explains is what it means institutionally. Divergence shows price is falling with less momentum, and that indicates the Big Guy stopped withdrawing liquidity and is returning it to the market. In other words: those who want to sell are now getting a good price, because someone on the other side is willing to buy. That someone is the Market Maker, accumulating.
When the first divergence of the cycle appears, it signals a wave change is coming. Price might turn from there, or it might make one more low before turning. But from the moment divergence appears, the permission changes: you stop selling. You look for the buy, as close to the low as possible.
What the video didn't cover: the strength of a divergence
There's a nuance worth developing. Not all divergences carry the same weight.
A divergence is more powerful the closer the MACD sits to the zero line when price makes the new low. If price makes a deeper low but the MACD barely separates from center, that compression indicates supply is essentially exhausted — the seller no longer has force, and the institutional side is absorbing nearly everything that comes in.
Compare that to a divergence where the MACD is still far from the zero line: there's exhaustion, yes, but selling pressure remains. The signal is valid but less compelling.
That gradation is what lets you calibrate position size and entry aggressiveness. Not all signals are equal, and knowing how to distinguish them separates the systematic operator from the one applying mechanical rules.
Signal line crosses: for exits, not entries
Here's an important correction to conventional teaching.
Most traders use the MACD line crossing the signal line as an entry trigger. That's entering late. By the time the cross occurs, a good part of the move has already happened.
The correct use of the cross is as a profit-taking signal. If you entered on the divergence — near the low, with minimal risk — the signal line cross tells you the move has matured and it's time to secure gains or reduce position. Enter on the divergence, exit on the cross. That's the correct order.
The Market Maker's cycle, simplified
The full cycle is remarkably simple once you see it:
If price is rising, the Market Maker wants to trap those buying at the highs. He withdraws liquidity from one side of the book so price falls, takes out the stops, and offers the worst price to the late buyers. When divergence appears, liquidity returns and the cycle inverts.
That cycle repeats indefinitely, in any market and any timeframe. And each turn of the cycle corresponds to an Elliott Wave completing. The MACD, read this way, becomes the clock that marks the end of each wave.
Application across three markets
The video demonstrates the method across three different instruments, and that variety isn't decorative — it's the proof that the principle is structural, not a coincidence of one specific market.
In the S&P futures (ES) the full concept is developed cycle by cycle, showing the liquidity withdrawal, the divergence, the turn, and the repetition of the process in the opposite direction.
In EUR/USD, an extended Wave 5 terminates precisely where the divergence appears, connecting the liquidity reading to the Elliott Wave count.
In gold, the filter of "always start with the strong MACDs" is applied — identify the large liquidity withdrawals first, and build the map of what's coming from there.
The operating plan, summarized
The whole method reduces to two complementary rules.
If you follow the trend: use the MACD to find the end of the correction and join the trend there. Wait for the liquidity withdrawal in the direction of the trend, then the retracement, and better still if there's divergence during the corrective wave.
If you fade the trend: wait for the divergence. That's your entry signal. And if you're already in the trend, the divergence is your signal to book profits.
In both cases, the rule that doesn't break: when the MACD is far from the zero line, don't trade against that momentum. You're fighting institutional liquidity withdrawal, and that's a fight you don't win.
The core idea
The MACD isn't a complete trading system — it needs other elements, and the Elliott Wave count is the natural complement. But as a reader of institutional liquidity, it's one of the most powerful and least understood tools available. It tells you when to enter, when to stay in the trade, and when the Market Maker is returning the liquidity he withdrew.
This is the kind of analysis we apply every day in our trading room, across multiple markets and timeframes.
Author

Juan Maldonado
Elliott Wave Street
Juan Maldonado has a University degree in Finance, and Foreign trade started his trading career in 2008. Since 2010 has been analyzing the markets using Elliott Wave with different strategies to spot high probability trades.