Here’s what could happen to S&P 500 according to Wyckoff’s efforts vs results [Video]
![Here’s what could happen to S&P 500 according to Wyckoff’s efforts vs results [Video]](https://editorial.fxstreet.com/images/Markets/Equities/SP500/wall-street-sign-637299022550250958.jpg)
Presence of hidden demand as reflected in the Wyckoff’s efforts vs results with the Wyckoff trading method together with the shortening of the thrust to the downside have given the bull a chance to prove itself.
Watch the video below and pay attention to the failure case at the critical level with stock market capitulation to the downside. The failure will violate the bullish scenario as demonstrated by the market breadth thrust in determining the market bottom.
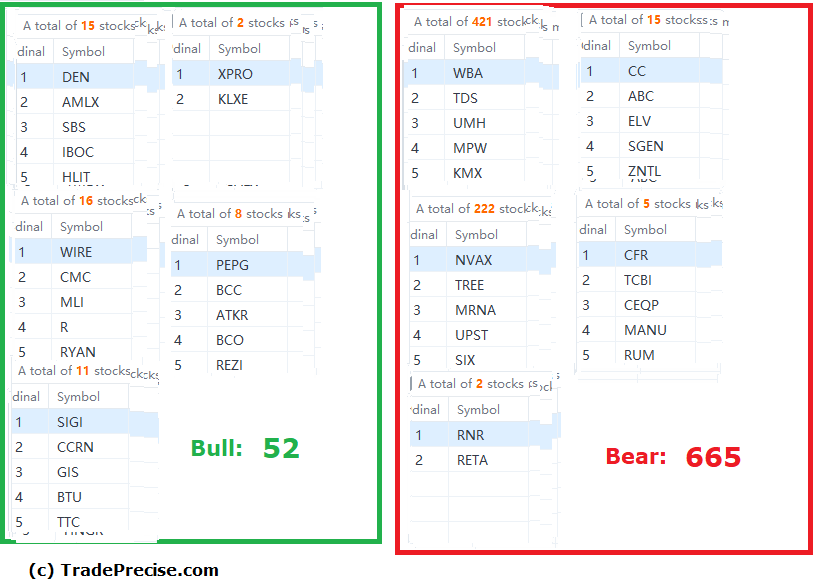
The bullish setup vs. the bearish setup is 52 to 665 from the screenshot of my stock screener below.
S&P 500 stalled at the key level at 3800 followed by a failure as it reacted to the non-farm payroll last Friday. The weakness in the S&P 500 continued to spook the prior market leaderships. So far, there is no leading industry group, which makes it hard for the market bottom scenario to materialize. The key to survive in this volatile market is to be nimble while picking the winning stocks to ride the momentum.
Author

Ming Jong Tey
Independent Analyst
Ming Jong Tey has been trading since 2008. He started his learning journey from technical analysis (indicators, Fibonacci, etc...) to value investing. Throughout his journey, he develops an interest in price action with chart pattern trading.


