Hedera (HBAR) tests make-or-break support after brutal decline

Hedera's HBAR token has been through the wringer. After spiking to nearly $0.39 earlier this year, the cryptocurrency has shed over 70% of its value, grinding lower in what's become a textbook downtrend. For those unfamiliar, Hedera operates a decentralized public network that uses a unique hashgraph consensus mechanism, positioning itself as an enterprise-grade alternative to traditional blockchains. But right now, the technical story matters more than the technology.
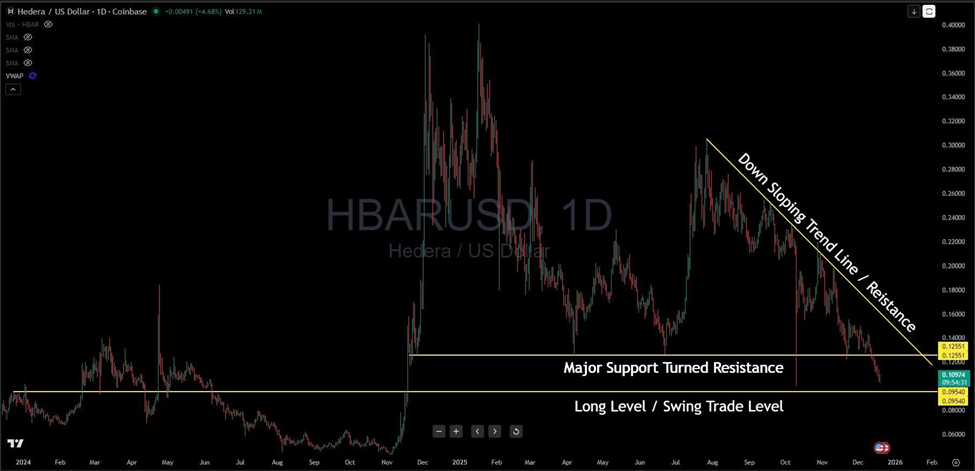
The chart paints a sobering picture. That yellow descending trendline connecting the lower highs since the peak? It's been an unforgiving ceiling, pushing price steadily downward like a slow-motion avalanche. Each rally attempt has been met with renewed selling pressure, creating that classic stair-step pattern lower that trend traders dream about—if they're positioned correctly.
What makes the current setup intriguing is where price has landed. HBAR is just above the $0.095-0.10 zone, marked as the "Long Level / Swing Trade Level" on my chart for good reason. This area represents a line in the sand. If buyers step up here, we could see a meaningful bounce that swing traders might exploit for a quick 20-30% move back toward that $0.125 resistance zone—the same level that once provided support but has now flipped to resistance, a textbook technical reversal that often acts as a magnet for failed rallies.
But let's be clear about the challenge ahead. Even if HBAR bounces from current levels, bulls face a gauntlet: first they'd need to reclaim $0.125, then break through that descending trendline that's defined this entire downtrend. That's a tall order in a market where selling pressure has been relentless.
The bearish scenario? If $0.095 gives way, there's not much visible support until you're looking at levels significantly lower. That's the risk that makes position sizing essential here.
For swing traders eyeing a long position, the strategy is straightforward: watch for bullish price action at current levels. A strong daily close above $0.105 with volume would be your confirmation. Set stops below $0.09 to limit downside, and target that $0.125 resistance for an initial profit-taking opportunity. For the more patient, a break above both $0.125 and the descending trendline would signal something more substantial might be developing.
Conversely, if you're bearish, wait for a decisive break below $0.095 on volume before considering short exposure. The downtrend remains intact until proven otherwise.
Author

Benjamin Pool
Verified Investing
A seasoned financial expert with a passion for empowering individuals to mastering smart money management.


