Growing short positions raise stakes for US stocks

US stocks and the Dow, Nasdaq, and S&P500 are all at their all-time highs from around late 2021 and early 2022. Take a look at those three indices here with the tops marked in.
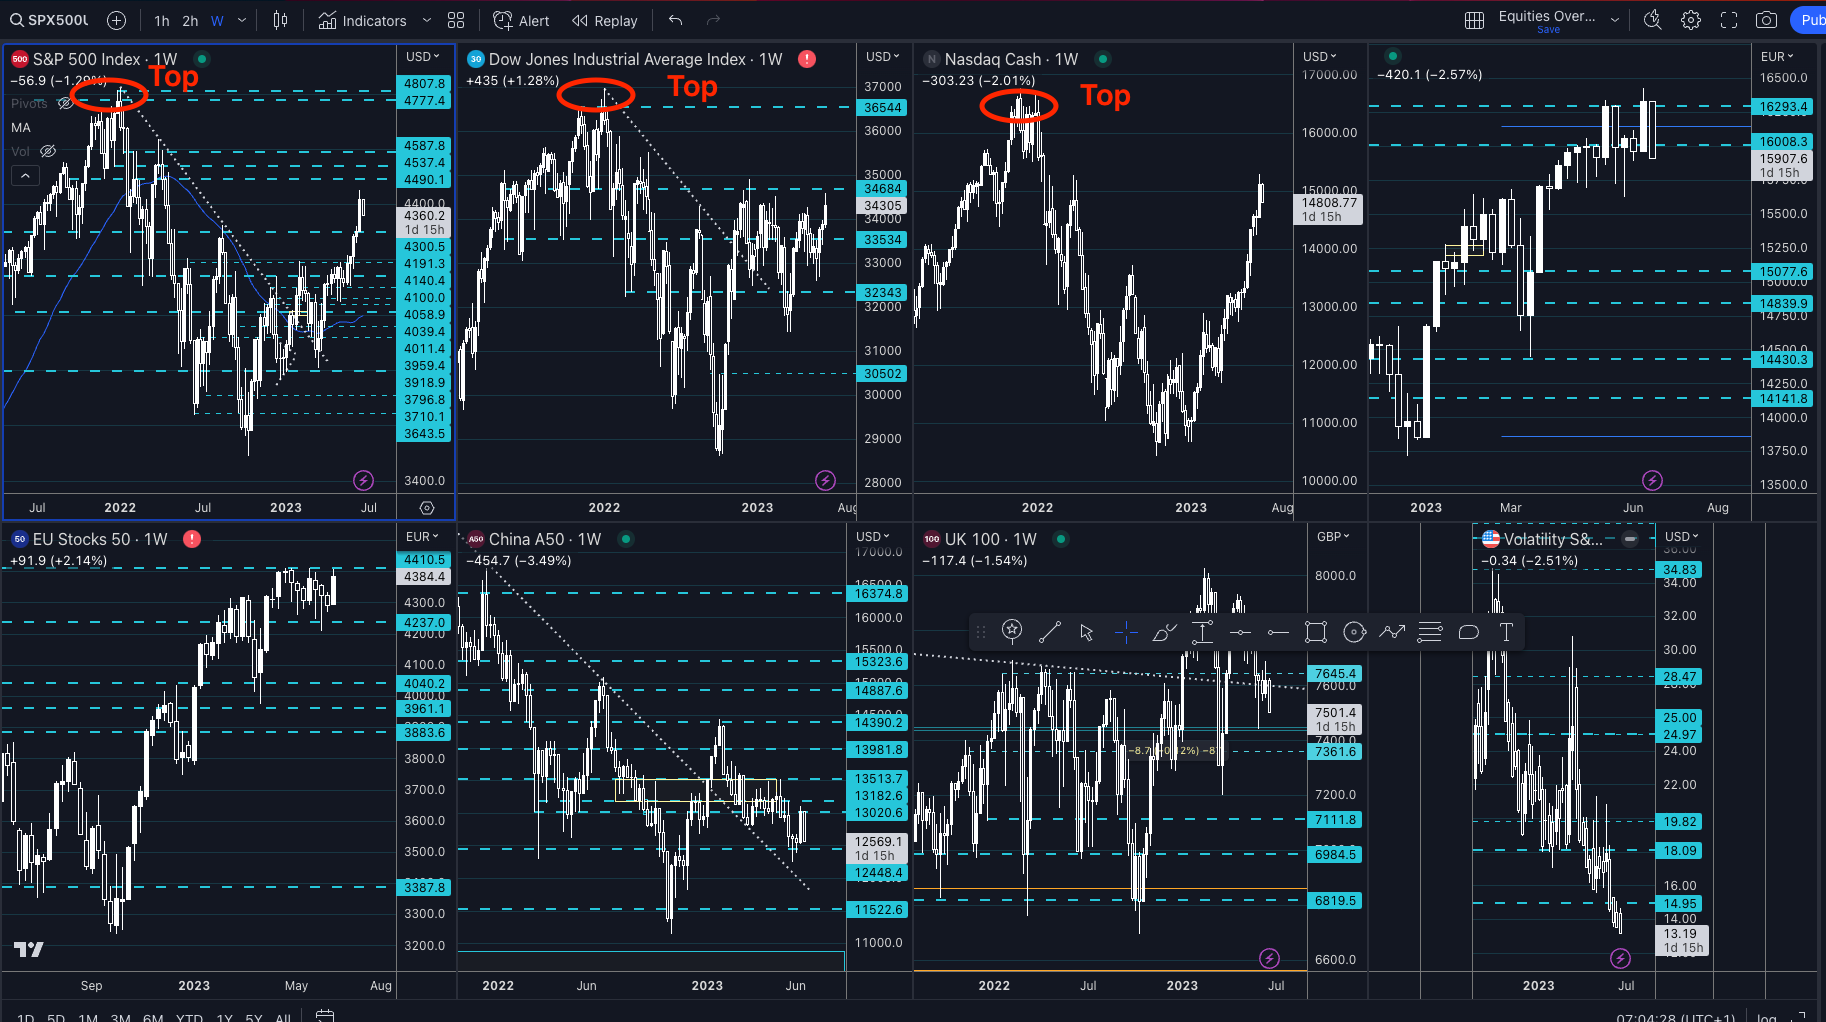
So, the recent rally in US stocks from the winter of last year has increasing concerns from a number of analysts that the rally is overdone. The recent tech rally based on AI hopes and better-than-expected earnings for the early part of this year now faces fresh concerns that the moves higher are stretched.
Short interest and days to cover ratio
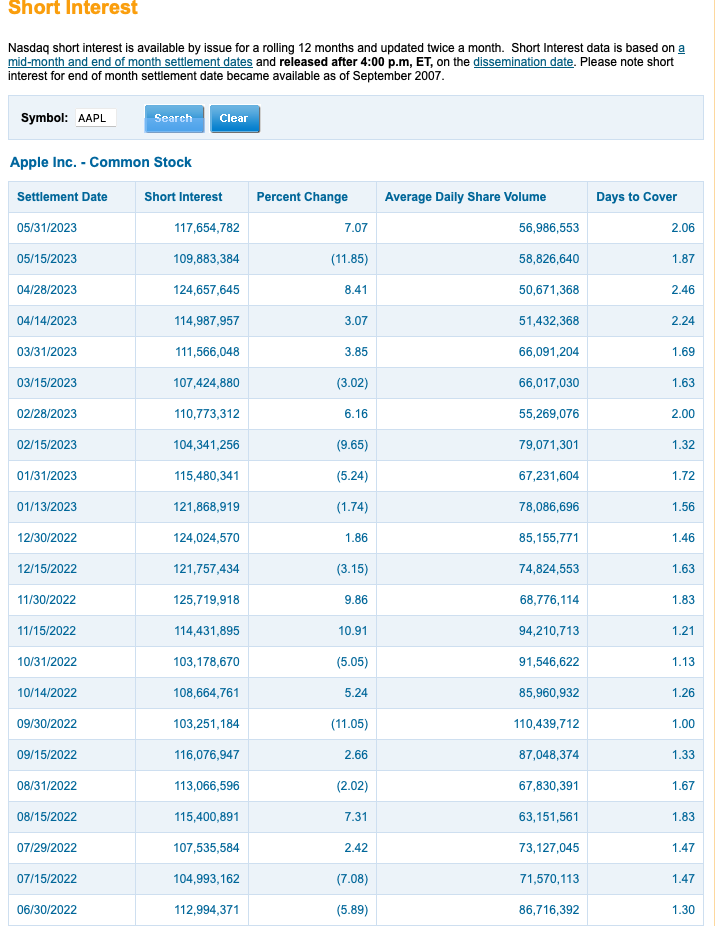
Stocks such as Tesla, Apple, Microsoft, and Nvidia, particularly of interest in the AI sector, are showing significant short interest, according to Bloomberg. The Days to Cover ratio, a metric used by investors and traders to gauge short interest, reveals the number of days it would take for short sellers to cover their positions based on average daily trading volume. A higher ratio indicates a larger short interest, which could create difficulties for short sellers to exit their positions swiftly. In such cases, a short squeeze may occur if positive news or substantial price increases force short sellers to buy back shares at higher prices. The NASDAQ website provides short interest data for stocks listed on the NASDAQ exchange. Here is an example of Apple’s short interest with the Days to Cover ratio on the right-hand side.
The risk of further moves higher
No one likes being wrong and if US stocks keep gaining some of the short sellers may be forced to buy back stocks in order to exit their positions. This would likely give equity markets another shove higher. However, seeing stocks break above all-time highs would seem a big ask, so this may give short sellers the confidence to hold, but every position has its limit. Citigroup sees 4,400 as a rough mid-year top for the S&P500. Stocks tend to have a weaker period over the summer which could cap a so-called bear market rally, if indeed it really is one. This certainly seems to be a key moment where sellers need to see stocks move in their direction, otherwise, the rally may gain on sellers covering their shorts.
Author

Giles Coghlan LLB, Lth, MA
Financial Source
Giles is the chief market analyst for Financial Source. His goal is to help you find simple, high-conviction fundamental trade opportunities. He has regular media presentations being featured in National and International Press.


