|premium|

Google (GOOG Stock) testing 38.2% fib support after 8% decline

Google (GOOG) made a bullish breakout above the bull flat pattern as expected in our previous wave analysis. But a bearish pullback is taking place soon after price confirmed a higher high.

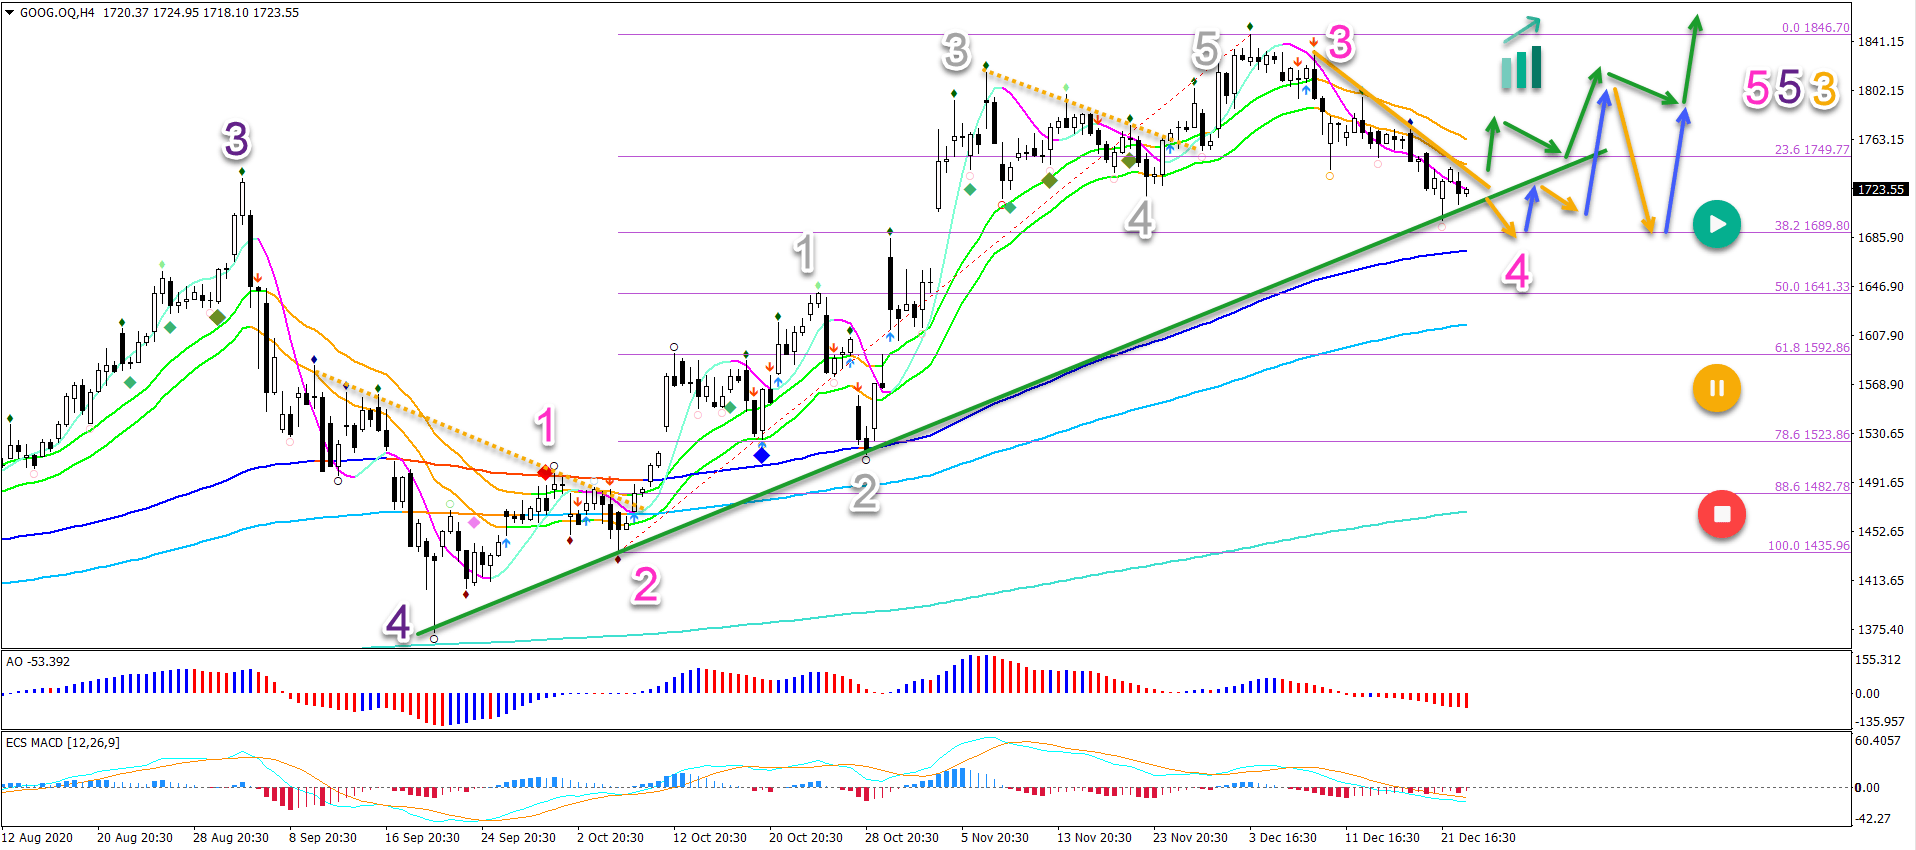
Price action is now testing the key support trend line (green) and the Fibonacci support. Let’s review what to expect.

Chart

Price Charts and Technical Analysis

Google seems to be in a wave 4 (pink) pattern. This means that the 38.2% Fibonacci retracement level is a key support zone within the uptrend.

A bullish bounce at the Fib could confirm our view. But a breakout above the resistance trend line (orange) and 21 ema zone is needed to indicate the end of wave 4 and start of wave 5 (pink).

Even a deeper retracement towards the 50-61.8% Fibonacci zone could be part of a wave 4. But a break below the 61.8% Fib certainly places the uptrend on hold (yellow circle) whereas a break below the top of wave 1 invalidates it (red circle).

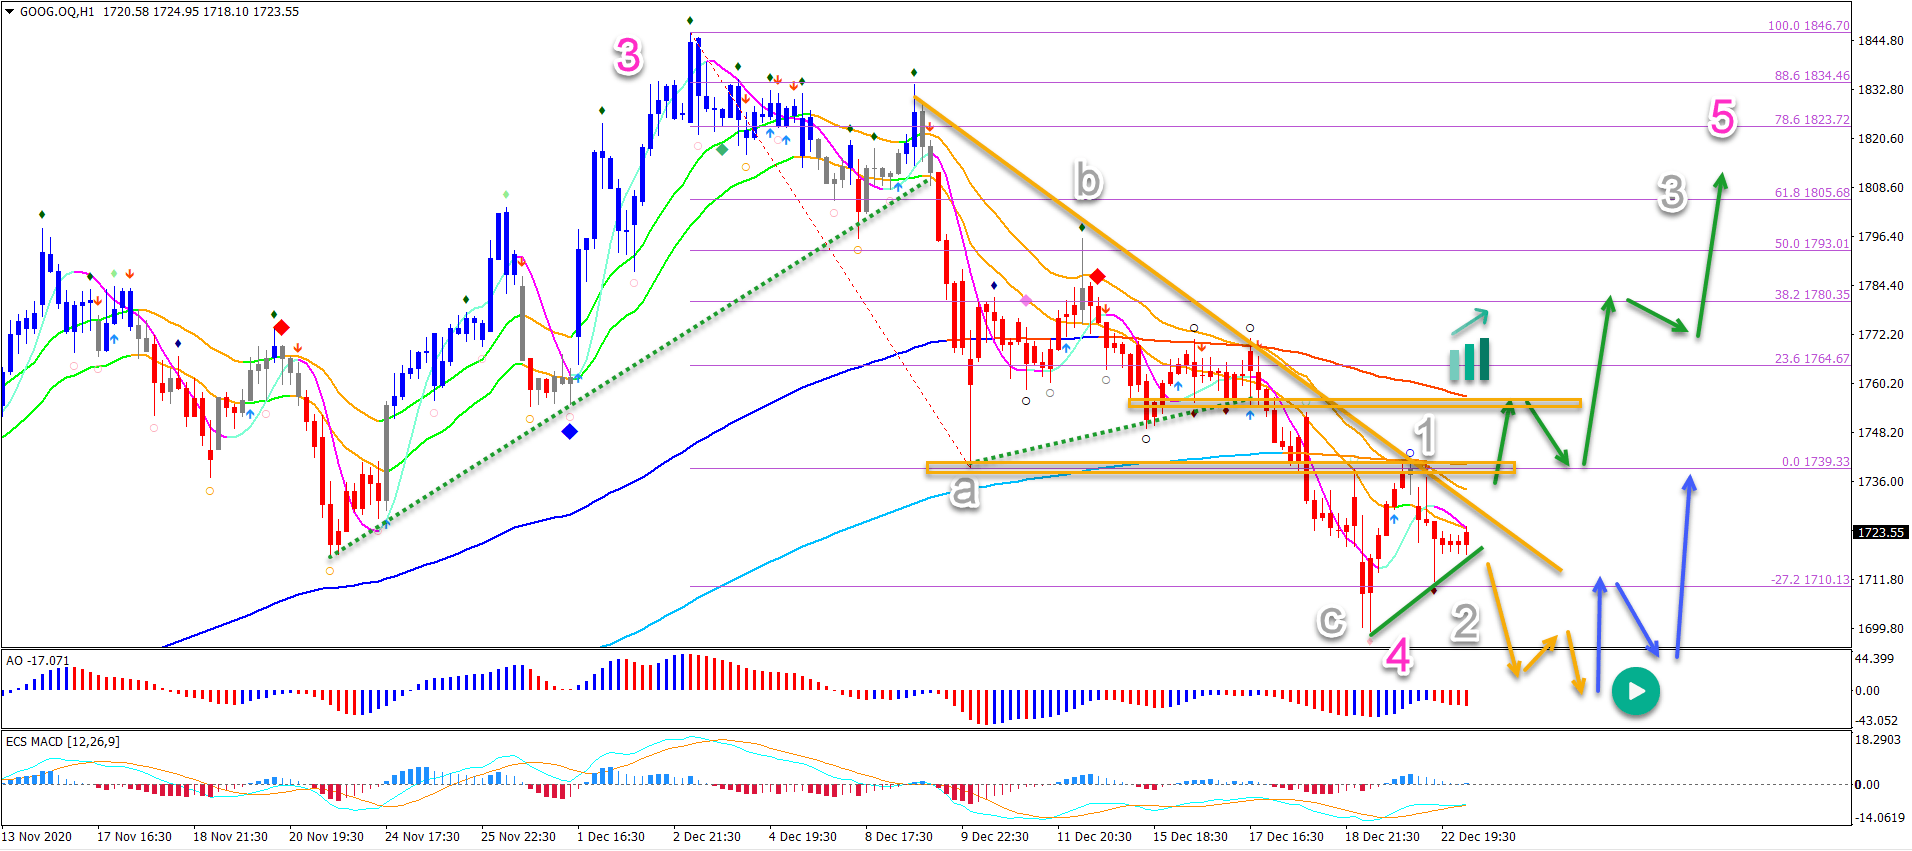
On the 1 hour chart, price action is building an ABC (grey) pattern. Which could complete wave 4 (pink) if price action can break above the local resistance (orange boxes) and long-term moving averages.

A break below the support trend line (green) indicates a push towards the 50% Fibonacci level mentioned on the 4 hour chart.

The bullish targets are first $1,800, followed by the previous top at $1,846 and the -27.2% Fibonacci target at around $1,950.

Chart

The analysis has been done with the ecs.SWAT method and ebook.

Premium

You have reached your limit of 3 free articles for this month.

Start your subscription and get access to all our original articles.

Subscribe to PremiumSign In

Author

Chris Svorcik

Chris Svorcik

FS method

Chris Svorcik is a trader, analyst, and educator with over 15 years of experience in financial markets, specializing in moving averages, market structure, and price patterns.

More from Chris Svorcik
Share:

Editor's Picks

EUR/USD edges higher to near 1.1600 on US-Iran Strait of Hormuz deal

The EUR/USD pair trades in positive territory around 1.1590 during the early Asian session on Tuesday. A deal to reopen the Strait of Hormuz spurred a rally in riskier assets such as the Euro against the US Dollar. Traders await the US Federal Reserve interest rate decision later on Wednesday. 

GBP/USD retreats from tops, back to 1.3420

GBP/USD keeps its advance past the 1.3400 yardstick at the beginning of the week. In the meantime, Cable continues to draw support from improved market sentiment following reports that the US and Iran have reached a framework agreement aimed at ending the conflict and reopening the Strait of Hormuz.

Gold posts modest gains as US‑Iran peace deal, fading Fed hike bets support bullion

Gold price trades with mild gains during the early Asian session on Tuesday. The precious metal extends the rally after the United States and Iran reached a comprehensive framework deal to end hostilities, easing inflation concerns. 

Indonesia may have stabilised the Rupiah, but the bigger fight is not over
Bank Indonesia’s emergency rate hike has bought the Rupiah some time, but the currency’s hesitant response suggests it has not yet restored confidence. Can higher interest rates solve the Rupiah’s problem, or do the country’s challenges run deeper?
RBA set for first interest-rate pause of 2026 as bets of further hikes weaken

The Reserve Bank of Australia is widely expected to leave the Official Cash Rate unchanged at 4.35% when it announces its monetary policy decision on Tuesday, marking a pause after three consecutive rate hikes delivered earlier this year. The decision will be announced at 04:30 GMT, accompanied by the Monetary Policy Statement.

4.2% headline, 0.2% core: Why the Fed's next hike may be targeting the wrong problem

May's CPI put headline inflation at 4.2% on the year, up from 3.8% in April and the hottest reading since April 2023, while core prices rose just 0.2% on the month, undershooting the 0.3% consensus and halving April's pace.