|

Gold Technical Analysis: Clears a descending trend-line hurdle and 200-hour SMA

   •  The precious metal regained positive traction on Wednesday and is now holding comfortably above a short-term descending trend-line resistance. 

   •  With short-term technical indicators gaining positive momentum, a follow-through up-move beyond 200-hour SMA adds credence to the bullish breakout.

   •  Hence, an extension of the positive momentum, led by some fresh technical buying, now looks a distinct possibility.
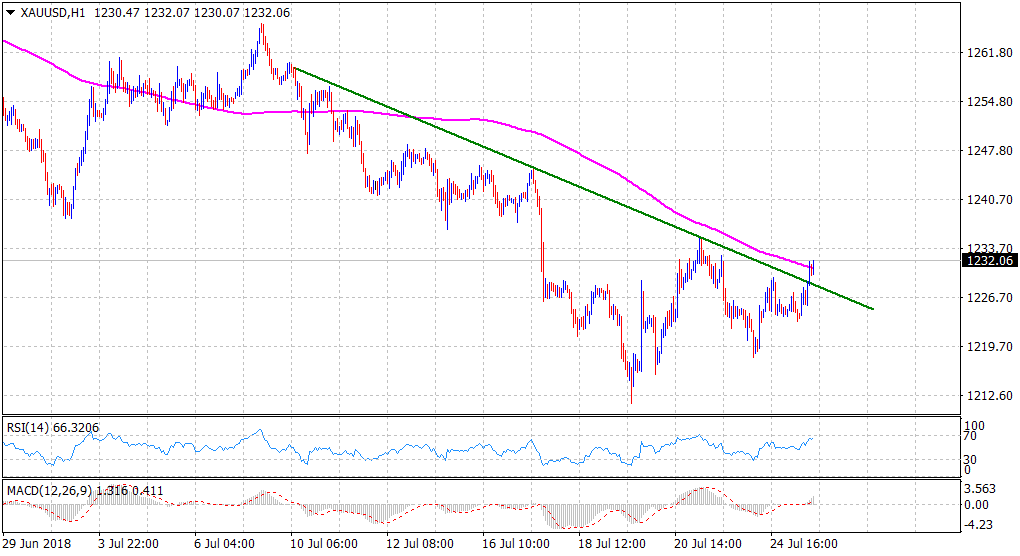
Gold 1-hourly chart

Spot rate: $1232
Daily Low: $1223
Trend: Bullish

Resistance
R1: $1235 (weekly tops set on Monday)
R2: $1242 (20-day SMA)
R3: $1248 (horizontal zone)

Support
S1: $1227 (horizontal zone)
S2: $1223 (recent daily closing low)
S3: $1218 (overnight swing low)
 

Author

Haresh Menghani

Haresh Menghani is a detail-oriented professional with 10+ years of extensive experience in analysing the global financial markets.


More from Haresh Menghani
Share:

Editor's Picks

GBP/USD advances to fresh monthly high above 1.3550

GBP/USD gains traction in the American session and trades at its highest level in a month at around 1.3550 on its way to a positive weekly closing. The US Dollar remains under pressure following the disappointing Retail Sales data and helps the pair push higher.

EUR/USD climbs toward 1.1600 on broad USD weakness

EUR/USD gathers bullish momentum on Friday and trades in positive territory above 1.1550. The US Dollar weakens heading into the weekend as markets continues to scale back bets for a rate hike in September following the disappointing July Retail Sales and UoM Consumer Sentiment data.

Gold bounces from weekly low on softer US Dollar, fading September Fed hike bets

Gold (XAU/USD) rebounds and closes in on $4,400 on Friday after opening the day in negative territory and falling to a fresh weekly low of $4,311, supported by a softer US Dollar (USD) and fading expectations of an imminent Federal Reserve (Fed) interest rate hike. The metal, however, remains below the two-month high of $4,449 touched on Thursday.

Pi Network Price Forecast: PI extends consolidation as bulls eye $0.10
Pi Network (PI) price holds steady on Friday, maintaining a consolidating tone for three consecutive days. Mild retail strength in the PI token remains stable, with Open Interest above $9 million, while social buzz eases. PI token’s technical outlook is mixed, as bearish momentum wanes to neutral, with bulls eyeing the $0.1000 psychological level.
 Weekly focus: Some relief in US inflation concerns

Actual inflation data for July came out as expected with a 0.1% m/m increase in headline CPI and 0.2% excluding food and energy. Annual headline inflation remains too high at 3.4% and means that wage earners are experiencing stagnating spending power at best, and core inflation is a bit higher than the inflation target of two percent would suggest.

Why is Crude Oil priced for a reopening the ships haven't made?
Fourteen vessels crossed the Strait of Hormuz on Tuesday. Before the war, the count ran near 120 a day. In the sessions since the waterway was publicly declared open, Brent has drifted back to $87 and West Texas Intermediate (WTI) to $81, both a little lower again on Wednesday, with daily momentum on each unwound from the top of its range in late July to the low twenties now.