Gold slips as USD rebounds, strong ISM data clouds Fed path
- Gold slips amid strong US data and Dollar recovery.
- Trump keeps Hormuz blockade in place until Iran signs deal.
- Strong ISM data complicates Fed outlook before key jobs reports.

Gold (XAU/USD) price retreats on Monday as the US Dollar (USD) recovers some ground, even though hostilities in the Middle East paused at the request of Iran and other Middle Eastern countries, according to US President Donald Trump. The XAU/USD pair trades at $4,037, down 0.12%.
XAU/USD retreats on geopolitical uncertainty, stronger US factory activity; Fed repricing
The Greenback has bounced off month-and-a-half lows reached earlier in the session, following an intervention in the FX markets by US and Japanese authorities, which propelled the Japanese Yen. Meanwhile, geopolitics is pushing US economic data to the backseat, as Trump crosses the wires.
He said that “Iran conflict is working out very well,” though added that Iran’s leadership is duplicitous, asking for talks, but publicly states that they’re not having discussions. Trump added that the US Navy blockade will stay in place until Iran signs a deal which includes to never having a nuclear weapon and keeping the Strait of Hormuz open.
Recently, the US President added: “I’m not going to let Iran charge to go through Hormuz Strait.”
On the data front, the Institute for Supply Management (ISM), reported that the Manufacturing Purchasers Managers Index (PMI) in July expanded at the highest pace in four years, with the PMI improving from 53.3 to 55.6, crushing forecasts of 54. The employment sub-component in companies rose for the first time since 2023, although prices paid suggest input costs still remain high.
The report showed sustained demand, clarity on tariffs, and the dissipation of supply disruptions related to the Gulf War, which increased demand in the jobs market.
Meanwhile, the dip in Oil prices triggered a repricing for a less hawkish Federal Reserve. Investors expect 22 basis points of tightening towards the end of 2026, according to Prime Terminal data.
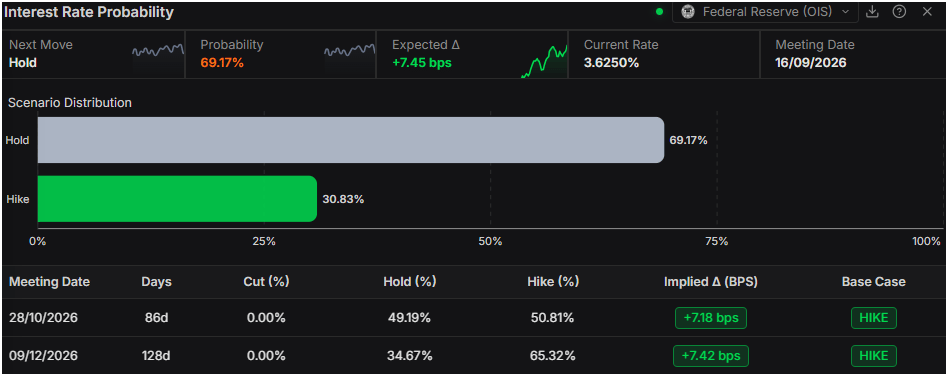
However, uncertainty in the US-Iran conflict remains high. A jump in energy prices could open the door to higher interest rates, which could prompt a repricing toward a more hawkish Fed.
At the last Fed meeting, three members dissented, opting for a 25-basis-point rate hike. They explained that delaying higher borrowing costs could keep inflation above the Fed's 2% target.
Recently, New York Fed President John Williams said the central bank was ready to tighten policy if inflation pressures did not ease.
This week, the US economic docket will feature a series of US jobs reports, including the ADP National Employment Change, the Job Openings and Labor Turnover Survey (JOLTS), jobless claims, and the Nonfarm Payrolls report.
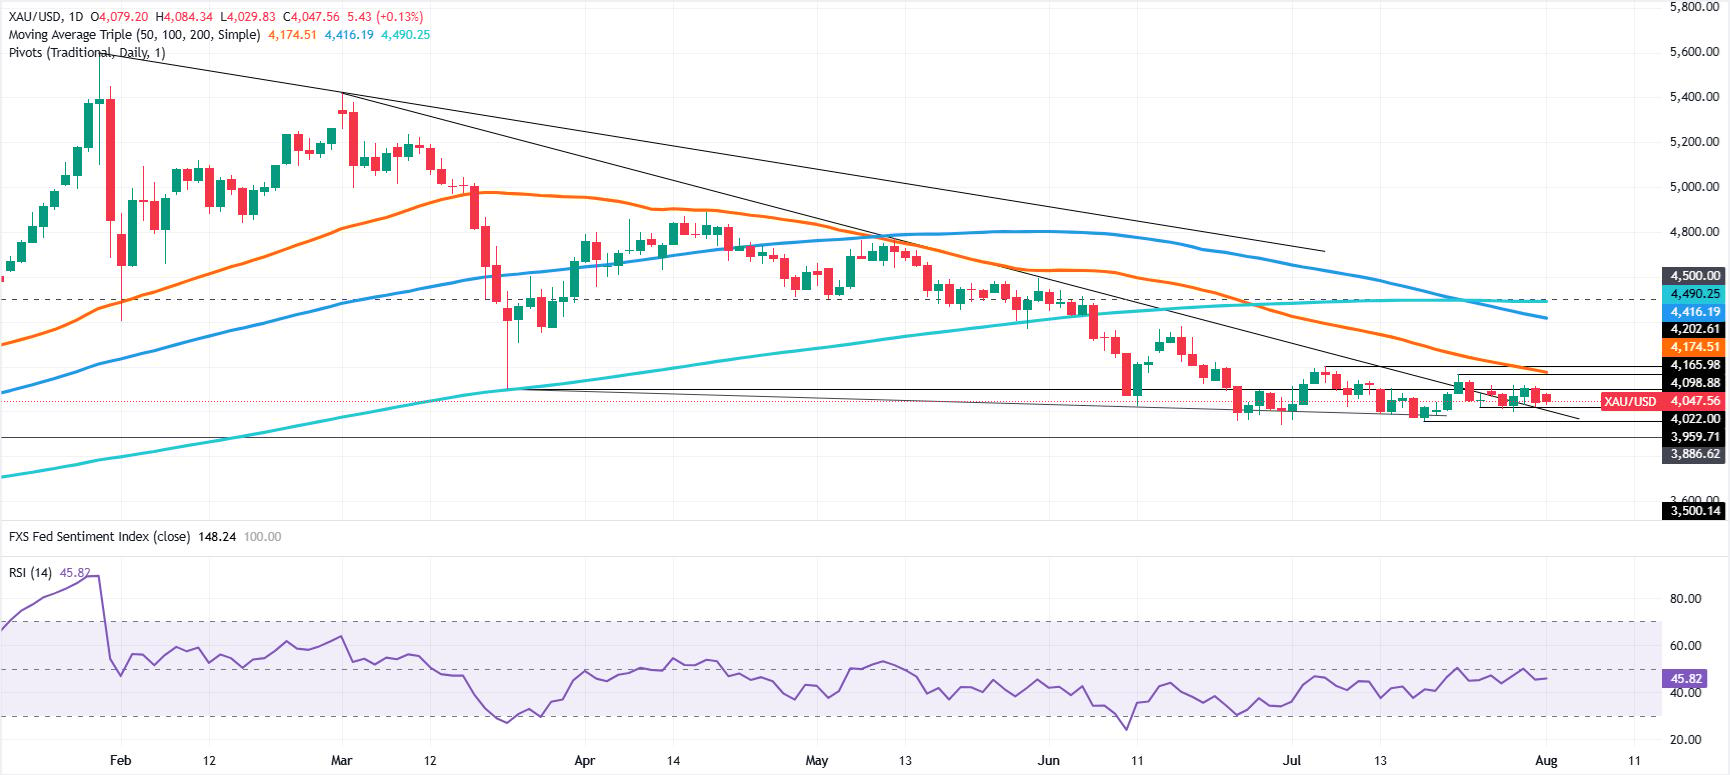
XAU/USD technical outlook: Gold trades above/below $4,050, directionless
Gold continues to move sideways after falling below the $4,100 level since mid-last week. Bullish momentum has faded, and the downside is evident in the Relative Strength Index (RSI).
The RSI, although bearish – below its 50-neutral level, shifted flattish after edging lower, an indication that neither buyers nor sellers are opening fresh directional bets.
Nevertheless, the market structure of a successive series of lower highs and lower lows, and Gold prices trading below the 200-day Simple Moving Average (SMA), suggest that further downside is seen in the short term.
Downwards, the first support is the July 24 low of $4,022. A break below this level could open the door to the key psychological level of $4,000 and the June 17 daily low of $3,959.
For a bullish continuation, buyers need to push back above $4,100, targeting the July 22 high of $4,165, with the possibility of testing the 50-day Simple Moving Average near $4,185. The next resistance sits at the July 6 peak of $4,202.
Gold FAQs
Gold has played a key role in human’s history as it has been widely used as a store of value and medium of exchange. Currently, apart from its shine and usage for jewelry, the precious metal is widely seen as a safe-haven asset, meaning that it is considered a good investment during turbulent times. Gold is also widely seen as a hedge against inflation and against depreciating currencies as it doesn’t rely on any specific issuer or government.
Central banks are the biggest Gold holders. In their aim to support their currencies in turbulent times, central banks tend to diversify their reserves and buy Gold to improve the perceived strength of the economy and the currency. High Gold reserves can be a source of trust for a country’s solvency. Central banks added 1,136 tonnes of Gold worth around $70 billion to their reserves in 2022, according to data from the World Gold Council. This is the highest yearly purchase since records began. Central banks from emerging economies such as China, India and Turkey are quickly increasing their Gold reserves.
Gold has an inverse correlation with the US Dollar and US Treasuries, which are both major reserve and safe-haven assets. When the Dollar depreciates, Gold tends to rise, enabling investors and central banks to diversify their assets in turbulent times. Gold is also inversely correlated with risk assets. A rally in the stock market tends to weaken Gold price, while sell-offs in riskier markets tend to favor the precious metal.
The price can move due to a wide range of factors. Geopolitical instability or fears of a deep recession can quickly make Gold price escalate due to its safe-haven status. As a yield-less asset, Gold tends to rise with lower interest rates, while higher cost of money usually weighs down on the yellow metal. Still, most moves depend on how the US Dollar (USD) behaves as the asset is priced in dollars (XAU/USD). A strong Dollar tends to keep the price of Gold controlled, whereas a weaker Dollar is likely to push Gold prices up.
Author

Christian Borjon Valencia
FXStreet
Markets analyst, news editor, and trading instructor with over 14 years of experience across FX, commodities, US equity indices, and global macro markets.
















