GBP/JPY Price Forecast: Evening star puts 207.00 back in play
- GBP/JPY retreats after failing to sustain gains above 209.00.
- Bearish RSI nears oversold territory as selling momentum strengthens.
- Break below 207.10 exposes 206.73 and 205.00 next.

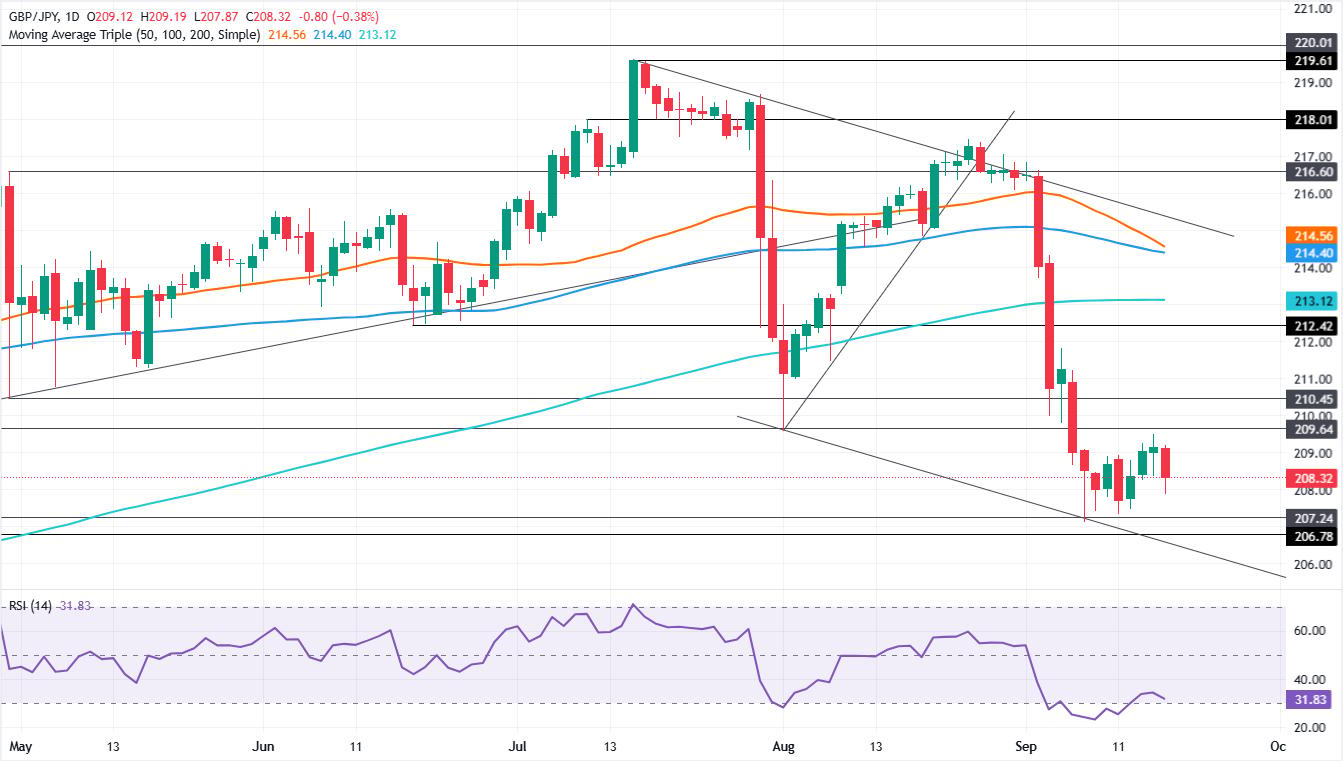
GBP/JPY makes a U-turn and loses about 0.39% on Thursday as risk appetite improves, while traders await a potential rate hike by the Bank of Japan (BoJ) later in Friday’s session. The cross-pair trades at 208.32 after reaching a high of 209.19.
GBP/JPY Price Forecast: Technical Outlook
Price action shows a potential formation of an ‘evening star’, a bearish candle pattern, which means that sellers are pushing the GBP/JPY pair lower to test yearly lows. Momentum, as measured by the Relative Strength Index (RSI), is bearish and about to turn oversold once more, an indication that bearish momentum is building.
That said, GBP/JPY's first support is the September 8 swing low at 207.10. Once surpassed, this would resume the downtrend structure of lower highs and lower lows, putting in play the December 16, 2025, low of the day (LOD)at 206.73, before the cross-pair dives to the psychological 205.00 milestone.
On the other hand, if GBP/JPY rises above the September 16 high of 209.47, a move to 210.00 is on the cards. On further strength, the next area of interest would be the September 4 swing high of 211.82, shy of 212.00.
GBP/JPY Price Chart – Daily
Japanese Yen Price Today
The table below shows the percentage change of Japanese Yen (JPY) against listed major currencies today. Japanese Yen was the strongest against the British Pound.
| USD | EUR | GBP | JPY | CAD | AUD | NZD | CHF | |
|---|---|---|---|---|---|---|---|---|
| USD | -0.11% | 0.19% | -0.22% | 0.02% | -0.32% | -0.35% | -0.18% | |
| EUR | 0.11% | 0.30% | -0.09% | 0.13% | -0.23% | -0.21% | -0.05% | |
| GBP | -0.19% | -0.30% | -0.38% | -0.16% | -0.52% | -0.51% | -0.32% | |
| JPY | 0.22% | 0.09% | 0.38% | 0.18% | -0.11% | -0.16% | 0.02% | |
| CAD | -0.02% | -0.13% | 0.16% | -0.18% | -0.32% | -0.35% | -0.15% | |
| AUD | 0.32% | 0.23% | 0.52% | 0.11% | 0.32% | -0.00% | 0.15% | |
| NZD | 0.35% | 0.21% | 0.51% | 0.16% | 0.35% | 0.00% | 0.21% | |
| CHF | 0.18% | 0.05% | 0.32% | -0.02% | 0.15% | -0.15% | -0.21% |
The heat map shows percentage changes of major currencies against each other. The base currency is picked from the left column, while the quote currency is picked from the top row. For example, if you pick the Japanese Yen from the left column and move along the horizontal line to the US Dollar, the percentage change displayed in the box will represent JPY (base)/USD (quote).
Author

Christian Borjon Valencia
FXStreet
Markets analyst, news editor, and trading instructor with over 14 years of experience across FX, commodities, US equity indices, and global macro markets.
















