Gold Price Forecast: XAUUSD readies for a descent towards $1,722 – Confluence Detector
- Gold Price returns to the red amid unabated US dollar demand.
- “Sell everything” mode persists, as risk-aversion remains at full steam.
- XAUUSD sees more downside, with eyes on the $1,722 key support.

Gold Price sees a negative start to the week so far this Monday, as the US dollar regains traction towards fresh two-decade highs. Risk-off flows dominate, in the face of looming fresh lockdowns in Shanghai and recession fears, which boost the dollar’s safe-haven appeal. Tighter US labor market conditions lift the odds of a total of 150 bps Fed rate hike in July and September to roughly around 30% from about 15% before Friday’s NFP release. Investors reassess the risk of a recession, with “sell everything” mode back in vogue and the greenback emerging as the undisputed winner. The USD-priced gold, therefore, appears vulnerable to more pain ahead amid a data-light start to the US inflaton week.
Also read: Gold Price Forecast: XAUUSD consolidates near YTD low, seems vulnerable to slide further
Gold Price: Key levels to watch
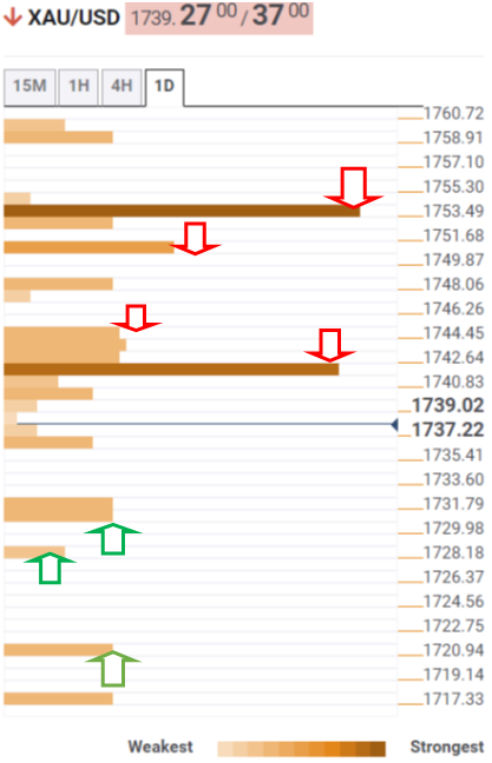
The Technical Confluence Detector shows that Gold Price is gathering strength to yield a fresh downside leg, with the previous day’s low of $1,730 in sight.
A breach of the latter will expose the Bollinger Band four-hour Lower at $1,728. The line in the sand for XAU bulls appears at $1,722, which is the pivot point one-day S2.
Alternatively, acceptance above the powerful hurdle of $1,742 is needed to initiate any meaningful recovery. That level is the confluence of the SMA10 four-hour, Fibonacci 61.8% one-day and the Bollinger Band one-day Lower.
The next stop for bulls is seen at the Fibonacci 38.2% one-day at $1,744. The Fibonacci 23.6% one-week at $1,750 will guard the further upside, a failure of which will challenge the convergence of the pivot point one-month S2 and pivot point one-day 1 at $1,753.
Here is how it looks on the tool
About Technical Confluences Detector
The TCD (Technical Confluences Detector) is a tool to locate and point out those price levels where there is a congestion of indicators, moving averages, Fibonacci levels, Pivot Points, etc. If you are a short-term trader, you will find entry points for counter-trend strategies and hunt a few points at a time. If you are a medium-to-long-term trader, this tool will allow you to know in advance the price levels where a medium-to-long-term trend may stop and rest, where to unwind positions, or where to increase your position size.
Author

Dhwani Mehta
FXStreet
Residing in Mumbai (India), Dhwani is a Senior Analyst and Manager of the Asian session at FXStreet. She has over 10 years of experience in analyzing and covering the global financial markets, with specialization in Forex and commodities markets.


