Gold Price Forecast: XAUUSD bears keep sight on $1,807 ahead of Fed – Confluence Detector
- Gold Price licks its wounds after hitting four-month lows at $1,810.
- Wall Street enters bear market, as a 75 bps June Fed rate hike looks likely.
- US dollar, yields to keep the upper hand, as XAU bulls remain under threat.

Gold Price is seeing a dead cat bounce above $1,800, having hit the lowest level in four months earlier this Tuesday. Increasing bets of a 75 bps Fed rate hike this week keep the sentiment around the US dollar, as well as, the Treasury yields buoyed. The safe-haven buck also draws support from the blood bath on global stocks amid growing fears of higher rates leading to a US recession, which tripped Wall Street into a bear market. The non-yielding XAUUSD is unlikely to attract solid bids heading into Wednesday’s Fed showdown.
Also read: Fed Preview: Powell to plunge markets or raise yields, a win-win for the dollar, five scenarios
Gold Price: Key levels to watch
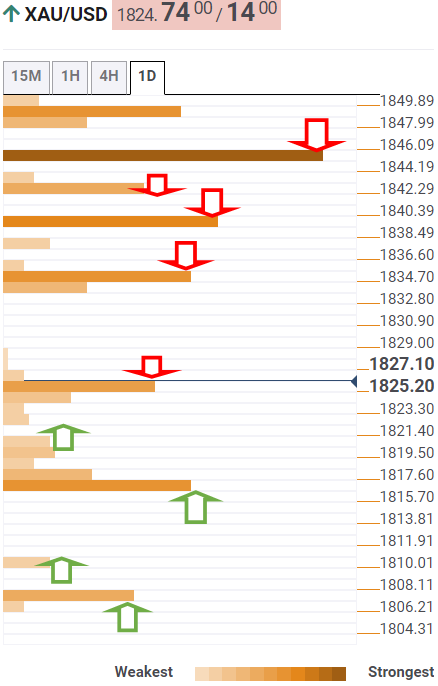
The Technical Confluence Detector shows that Gold Price is struggling to extend its recovery near the $1,826 hurdle, where the previous week’s low aligns.
Acceptance above the latter could initiate a fresh upswing towards the powerful resistance around $1,833, the confluence of the Fibonacci 38.2% one-month and Fibonacci 23.6% one-day.
The pivot point one-week S1 at $1,839 will challenge the bulls on the road to recovery. Further up, the convergence of the Fibonacci 38.2% one-day and SMA200 one-day at $1,841 will come into play.
The last line of defense for XAU sellers is pegged at $1,846, which is the Fibonacci 61.8% one-week.
On the flip side, the immediate support awaits at the $1,820 round figure, below which bears will look out for the strong support around $1,816, where the Fibonacci 23.6% one-month collides into the Bollinger Band one-day Lower.
The previous low four-hour at $1,810 will come to the rescue of gold buyers on selling resurgence.
The next and the final stop for bears is seen at $1,807, the pivot point one-week S2.
Here is how it looks on the tool
About Technical Confluences Detector
The TCD (Technical Confluences Detector) is a tool to locate and point out those price levels where there is a congestion of indicators, moving averages, Fibonacci levels, Pivot Points, etc. If you are a short-term trader, you will find entry points for counter-trend strategies and hunt a few points at a time. If you are a medium-to-long-term trader, this tool will allow you to know in advance the price levels where a medium-to-long-term trend may stop and rest, where to unwind positions, or where to increase your position size.
Author

Dhwani Mehta
FXStreet
Residing in Mumbai (India), Dhwani is a Senior Analyst and Manager of the Asian session at FXStreet. She has over 10 years of experience in analyzing and covering the global financial markets, with specialization in Forex and commodities markets.