|

Gold Price Forecast: XAU/USD sees downside below $1,830 ahead of Fed Powell

  • Gold price has plunged below the critical support of $1,836.00 firmly.
  • Investors have shifted the spotlight on Fed Powell’s testimony.
  • The market participants should brace for underperformance from the US PMI.

Gold price (XAU/USD) has witnessed a steep fall after failing to sustain above the critical hurdle of $1,840.00 in the early European session. The precious metal is hovering around the cushion of $1,835.00 and an extension of a downside move looks possible as uncertainty ahead of the Federal Reserve (Fed) chair Jerome Powell’s testimony cannot be ruled out.

The US dollar index (DXY) has displayed a modest rebound after re-testing Monday’s low at 104.23. A sideways move is expected from the DXY as investors are awaiting Fed’s testimony to take informed decisions. Apart from Fed’s testimony, US Purchase Managers Index (PMI) will remain in focus, which is due on Thursday.

The Composite PMI is seen higher marginally to 53.5 from the prior print of 53.4. While the Manufacturing and Services PMIs are indicating a severe underperformance. The Services PMI is seen significantly lower at 49.1 against the prior print of 53.2. Also, the Manufacturing PMI is expected to shift lower to 54.7 from the former figure of 55.7.

Gold technical analysis

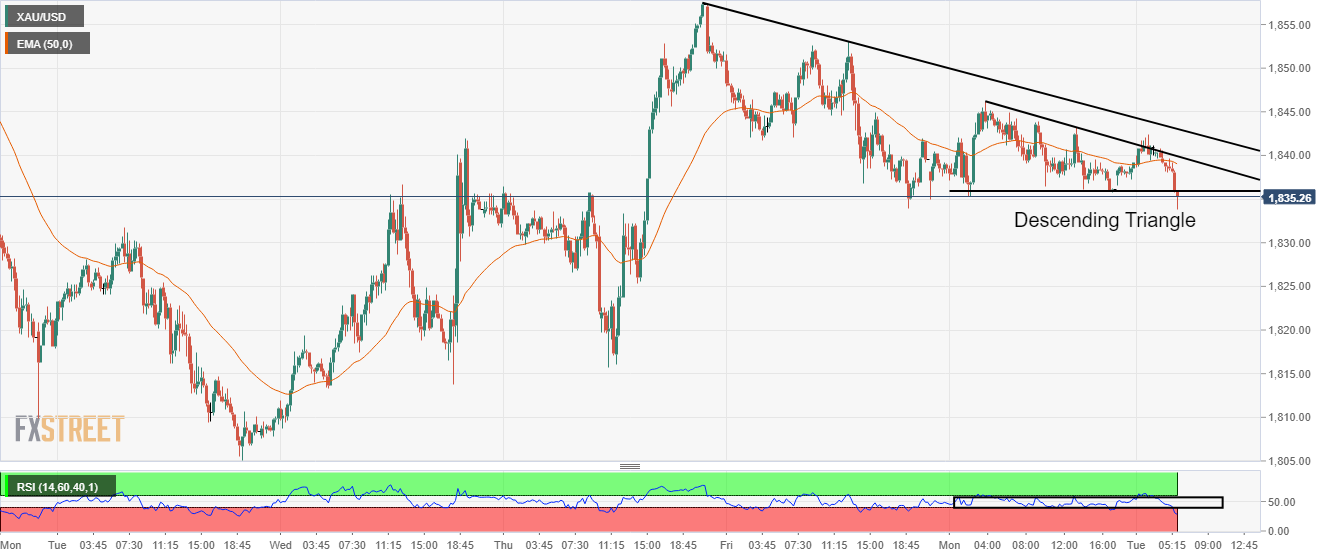
The gold prices have given a downside break of the Descending Triangle whose horizontal support is placed from $1,836.04 while the downward sloping trendline is plotted from Monday’s high at $1,845.54. The primary trendline placed from last week’s high at $1,857.58 has acted as a major barricade for the gold bulls.

Gold bulls witnessed a steep fall after failing to defend the 50-period Exponential Moving Average (EMA) at $1,838.26. Meanwhile, the Relative Strength Index (RSI) has slipped into the bearish range of 20.00-40.00, which signals more downside ahead.

Gold intraday chart

XAU/USD

Overview
Today last price1835.98
Today Daily Change-0.09
Today Daily Change %-0.00
Today daily open1836.07
 
Trends
Daily SMA201847.23
Daily SMA501872.33
Daily SMA1001890.88
Daily SMA2001843.22
 
Levels
Previous Daily High1846.18
Previous Daily Low1834.9
Previous Weekly High1879.26
Previous Weekly Low1805.11
Previous Monthly High1909.83
Previous Monthly Low1786.94
Daily Fibonacci 38.2%1839.21
Daily Fibonacci 61.8%1841.87
Daily Pivot Point S11831.92
Daily Pivot Point S21827.77
Daily Pivot Point S31820.64
Daily Pivot Point R11843.2
Daily Pivot Point R21850.33
Daily Pivot Point R31854.48

Author

Sagar Dua

Sagar Dua

FXStreet

Sagar Dua is associated with the financial markets from his college days. Along with pursuing post-graduation in Commerce in 2014, he started his markets training with chart analysis.

More from Sagar Dua
Share:

Editor's Picks

EUR/USD seems fragile below 1.1700 as Middle East war boosts energy prices

The EUR/USD pair trades flat at around 1.1680 during the Asian trading session on Tuesday, but broadly seems vulnerable, being close to its five-week low. The major currency pair is under pressure as surging oil prices due to the United States-Israel war with Iran have increased the risks of higher inflation for the Old Continent.

GBP/USD hovers around 1.3400 with bearish pressure intact

GBP/USD edges higher after three days of losses, trading around 1.3400 during the Asian hours on Tuesday. The technical analysis of the daily chart indicates an ongoing bearish bias, as the pair trades within a descending channel pattern.

Gold stays bullish as Iran war continues to spur safe-haven flows

Gold is finding renewed bids in Asian trades on Tuesday, making another attempt to regain the $5,400 level amid persistent demand for safe-haven assets as the Iran war extends. A softer risk tone remains in play as US President Donald Trump continues to threaten deeper escalation to the ongoing war with Iran, warning that a “big wave” is yet to come.

Top Crypto Gainers: Near Protocol, Virtuals Protocol, and Morpho lead market recovery

Near Protocol, Virtuals Protocol, and Morpho are leading the market recovery with double-digit gains over the last 24 hours. Technically, NEAR extends the breakout of the falling channel pattern, VIRTUAL holds above the 50-day EMA, while MORPHO tests a crucial resistance. 

The market is not panicking it is repricing the probability distribution of Oil and time

At the end of the day, markets do not trade morality or geopolitics. They trade transmission channels. And the only channel that truly matters in this maelstrom runs through the price of energy and the time value of money.

Grass 20% bullish breakout defies broader market weakness

Grass (GRASS) is edging up above $0.30 at the time of writing on Monday. The token’s notable 20% intraday surge stands out amid heightened volatility in the broader crypto market.