Gold Price Forecast: XAU/USD remains poised to test $1,688 key support – Confluence Detector
- Gold price is licking its wounds near $1,700 after Tuesday’s sharp sell off.
- The US dollar retreats amid a USD/JPY slide and a pause in the yields rally.
- XAU/USD looks south amid a wall of powerful resistance levels.

Gold price is consolidating the previous sell off, as bears are taking a breather before resuming the next leg lower. A pause in the US Treasury yields rally combined with a broad US dollar retreat is offering a temporary reprieve to gold buyers. The bright metal remains vulnerable amid the revival of hopes for aggressive Fed tightening in the coming months. The US inflation data outpaced estimates and squashed the ‘peak inflation’ narrative, suggesting that the Fed will continue with bigger and more rapid rate hikes to control inflation. According to the CME FedWatch Tool, markets are now pricing a 36% chance of a full percentage point Fed rate hike next week. Attention now turns towards the US key events in the second half of the week for fresh trading opportunities in the bullion.
Also read: Gold Price Forecast: XAU/USD eyes 2022 low at $1,681 amid aggressive Fed rate hike bets
Gold Price: Key levels to watch
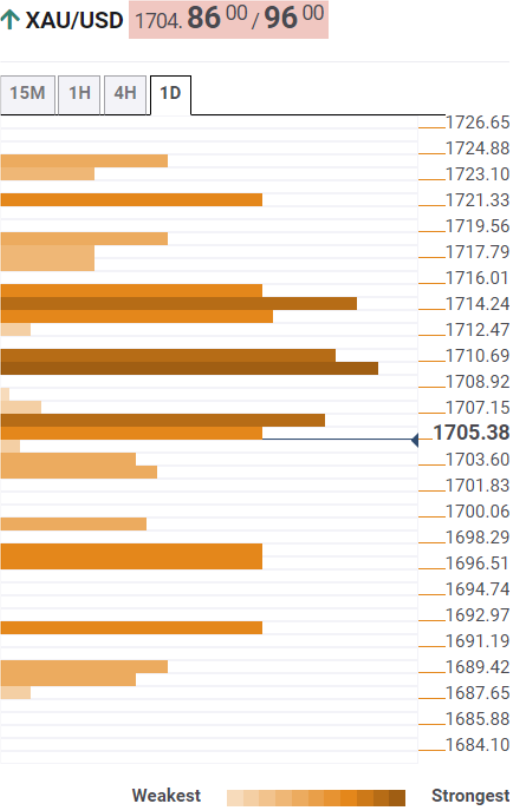
The Technical Confluence Detector shows that the gold price is eyeing a firm break below the SMA5 four-hour at $1,702 to resume the bearish momentum towards the previous day’s low of $1,697.
Bears will then gear up for a test of the previous week’s low of $1,691, below which the convergence of the pivot point one-day S1 and Bollinger Band one-day Lower at $1,688 will be put at risk.
On the flip side, strong resistance is seen around $1,707, the confluence of the Fibonacci 61.8% one-week and the Fibonacci 23.6% one-day. Acceptance above the latter is needed to offer a fresh boost to XAU bulls.
The next relevant upside target is aligned at $1,710, the meeting point of the Fibonacci 38.2% one-day and SMA10 one-day. Further up, the intersection of the SMA5 one-day and the Fibonacci 38.2% one-week at $1,715 will be the level to beat for bulls.
Here is how it looks on the tool
About Technical Confluences Detector
The TCD (Technical Confluences Detector) is a tool to locate and point out those price levels where there is a congestion of indicators, moving averages, Fibonacci levels, Pivot Points, etc. If you are a short-term trader, you will find entry points for counter-trend strategies and hunt a few points at a time. If you are a medium-to-long-term trader, this tool will allow you to know in advance the price levels where a medium-to-long-term trend may stop and rest, where to unwind positions, or where to increase your position size.
Author

Dhwani Mehta
FXStreet
Residing in Mumbai (India), Dhwani is a Senior Analyst and Manager of the Asian session at FXStreet. She has over 10 years of experience in analyzing and covering the global financial markets, with specialization in Forex and commodities markets.

















