Gold Price Forecast: XAU/USD likely to extend range play around $1,660 – Confluence Detector
- Gold price is turning south once again after facing rejection at higher levels.
- The metal is defending gains amid a broadly weaker US dollar, risk-aversion.
- XAU/USD battle lines are well-defined around $1,660 ahead of key US events.

Gold price is moving back and forth in a familiar range above $1,650, as the investors refrain from placing any directional bets amid rife geopolitical tensions concerning Russia and Ukraine, aggressive Fed rate hike bets and surging oil prices. Meanwhile, the US dollar is trading choppy but slightly on the downside, limiting the downside in the bullion. The UK tax policy U-turn put a sudden bid under GBP/USD, inducing fresh weakness in the dollar while helping the metal defend mild gains. Attention turns towards the US ISM Manufacturing PMI after the euro area and the UK S&P Global final Manufacturing PMIs failed to impress the market. The main event risk this week, however, remains the US Nonfarm Payrolls data due for release this Friday.
Also read: Gold Price Forecast: XAU/USD could see selling resurgence near $1,680
Gold Price: Key levels to watch
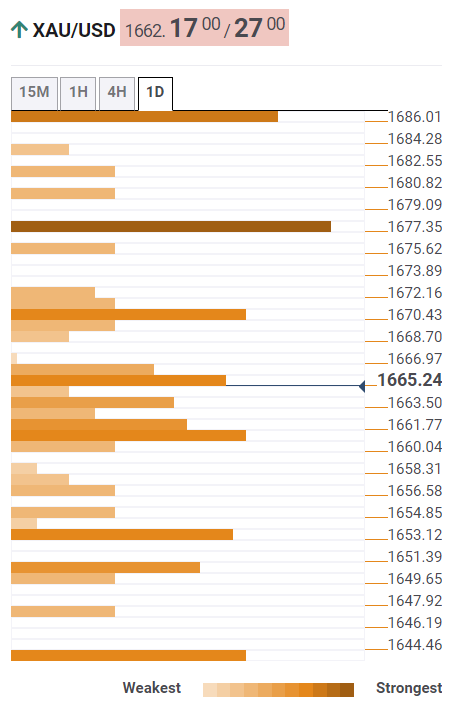
The Technical Confluence Detector shows that the gold price is looking to challenge the $1,660 support area, where the previous day’s low, Fibonacci 38.2% one-month and Fibonacci 23.6% one-week coincide.
The SMA10 one-day at $1,657 will be seen as the next stop for sellers. Further down, the confluence of the SMA50 four-hour and Fibonacci 38.2% one-week around $1,654 could be tested.
The pivot point one-day S2 and SMA100 one-hour meeting point at $1,650 will be the line in the sand for buyers.
On the flip side, the Fibonacci 38.2% one-day at $1,665 offers immediate resistance to bulls, above which a run towards the $1,670 level cannot be ruled out. That level is the convergence of the Fibonacci 61.8% one-day and the pivot point one-day R1.
The previous day’s high of $1,675 will be next on the buyers’ radar, followed by the previous year’s low at $1,677.
Here is how it looks on the tool
About Technical Confluences Detector
The TCD (Technical Confluences Detector) is a tool to locate and point out those price levels where there is a congestion of indicators, moving averages, Fibonacci levels, Pivot Points, etc. If you are a short-term trader, you will find entry points for counter-trend strategies and hunt a few points at a time. If you are a medium-to-long-term trader, this tool will allow you to know in advance the price levels where a medium-to-long-term trend may stop and rest, where to unwind positions, or where to increase your position size.
Author

Dhwani Mehta
FXStreet
Residing in Mumbai (India), Dhwani is a Senior Analyst and Manager of the Asian session at FXStreet. She has over 10 years of experience in analyzing and covering the global financial markets, with specialization in Forex and commodities markets.

















