|

Gold Price Forecast: XAU/USD fails to kiss $1,950 as USD Index attempts recovery

  • Gold price is struggling to test the $1,950.00 resistance as anxiety soars ahead of the US GDP.
  • The USD Index is building a cushion around 101.10 but could deliver a breakdown amid a risk-on mood.
  • Rising odds of a smaller interest rate hike by the Fed are weighing down US yields.
  • When is the preliminary US GDP report and how could it affect EUR/USD?

Gold price (XAU/USD) has sensed selling pressure while attempting to kiss the critical resistance of $1,950.00. The precious metal is not getting the desired strength required to hit the $1,950.00 hurdle as investors are getting anxious ahead of the release of the United States Gross Domestic Product (GDP) and other critical economic data.

The US Dollar Index (DXY) is constantly grueling to build a cushion around 101.20 despite the upbeat market mood. S&P500 futures are displaying moderate gains, conveying the expression of the solid risk appetite of the market participants. The 10-year US Treasury yields have dropped to near 3.44%.

The street is continuously discussing the chances of a US recession in CY2023 as the Federal Reserve (Fed) has already tightened monetary policy significantly. The release of the US GDP data will provide more clarity about the scales of economic activities in the fourth quarter of CY2022. As per the projections, the US GDP is expected to contract to 2.6% from the former release of 3.2%. More-than-expected contraction in economic activities might bolster the case of a smaller interest rate hike by the Fed.

Gold technical analysis

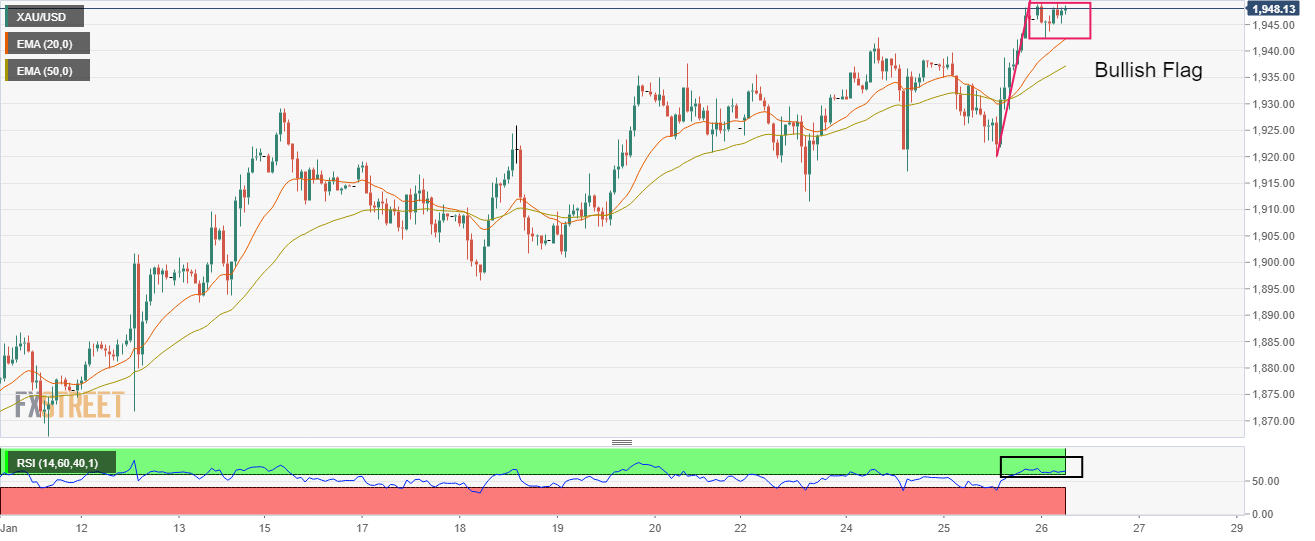
Gold price is forming a Bullish Flag chart pattern on an hourly scale, which indicates a continuation of the bullish momentum after the breakout of a consolidation. Usually, the consolidation phase of the chart pattern serves as an inventory adjustment in which those participants initiate longs, which prefer to enter an auction after the establishment of a bullish bias.

Advancing 20-and 50-period Exponential Moving Averages (EMAs) at $1,942.46 and $1,937.35 respectively add to the upside filters.

The Relative Strength Index (RSI) (14) is oscillating in a bullish range of 60.00-80.00, which indicates more upside ahead.

Gold hourly chart

XAU/USD

Overview
Today last price1948.61
Today Daily Change1.88
Today Daily Change %0.10
Today daily open1946.73
 
Trends
Daily SMA201885.23
Daily SMA501822.32
Daily SMA1001750.98
Daily SMA2001775.61
 
Levels
Previous Daily High1948.17
Previous Daily Low1919.91
Previous Weekly High1937.57
Previous Weekly Low1896.63
Previous Monthly High1833.38
Previous Monthly Low1765.89
Daily Fibonacci 38.2%1937.37
Daily Fibonacci 61.8%1930.71
Daily Pivot Point S11928.37
Daily Pivot Point S21910.01
Daily Pivot Point S31900.11
Daily Pivot Point R11956.63
Daily Pivot Point R21966.53
Daily Pivot Point R31984.89

Author

Sagar Dua

Sagar Dua

FXStreet

Sagar Dua is associated with the financial markets from his college days. Along with pursuing post-graduation in Commerce in 2014, he started his markets training with chart analysis.

More from Sagar Dua
Share:

Editor's Picks

AUD/USD falls to near 0.7100 after slipping below 50-day EMA

AUD/USD depreciates after registering minor gains in the previous day, trading around 0.7120 during the Asian hours. The technical analysis of the daily chart shows the pair consolidating sideways within a rectangle pattern, as neither bulls nor bears gain control. The AUD/USD pair is holding a slight bearish tone however as it sits beneath both the nine-day and 50-day EMAs.

160.00: USD/JPY back near intervention territory after upbeat US jobs report

US Nonfarm Payrolls beat expectations by a wide margin in May, with 172K jobs added. The US Dollar rebounds after the release, helping USD/JPY recover from its intraday lows. Warnings from Japanese authorities continue to limit upside potential near the 160.00 threshold.

Gold targets $4,300 amid stronger Dollar

Gold faces increasing selling interest and navigates the area of three-month lows near the $4,300 mark per troy ounce on Friday. The precious metal’s decline comes as traders assess the stronger-than-expected NFP, while the bid bias in the Greenback and higher US Treasury yields also collaborate with the retracement.

Cardano hits five-year low even as Hoskinson clarifies "break" isn't an exit

Cardano (ADA) price is down 10% at press time on Friday, extending losses over 30% so far this week amid Charles Hoskinson's clarification that "break" isn't an exit.

Week ahead – Fed countdown begins amid US inflation data and geopolitical risks

Fed Chair Warsh’s first meeting approaches as key US inflation data could reshape expectations. Oil prices remain elevated as US-Iran talks continue; tariffs also return to the spotlight. ECB is expected to hike; will it be a one-off move or is July live?

The US economy defies the rules: 100 days into the Oil shock and the recession signal is still missing

More than three months after the start of the Iran war and the resulting disruption to global energy markets, the US economy continues to display remarkable resilience. The conflict has triggered a sharp rise in Oil prices, reignited inflationary pressures and fueled widespread concerns about a potential economic slowdown.