Gold Price Forecast: XAU/USD eyes key resistance at $1,735 ahead of US inflation – Confluence Detector
- Gold price is replicating Monday’s price action, resuming recovery towards $1,735.
- The US dollar keeps falling with the Treasury yields amid a global risk rally.
- XAU/USD’s fate hinges on critical US inflation as Fed is set to hike rates by 75 bps next week.

Gold price is building on the previous recovery momentum, reversing the dip seen earlier in the Asian session. Markets are duplicating Monday’s moves, as the US dollar correction kicks in again amid a renewed weakness in the Treasury yields, allowing bulls to regain the upside traction. The extended risk rally globally is on the heels of expectations of more Chinese stimulus, inflation peaking in the US and some optimism surrounding Ukraine’s progress against Russia. All eyes now remain on the US inflation data for August, which will provide a fresh cue on the Fed’s rate hike path, with the world’s most powerful central bank seen hiking rates by 75 bps next week. An upside surprise in the core CPI could be on the cards, given the lower consensus.
Also read: Gold Price Forecast: XAU/USD could attack $1,700 on a US core CPI upside surprise
Gold Price: Key levels to watch
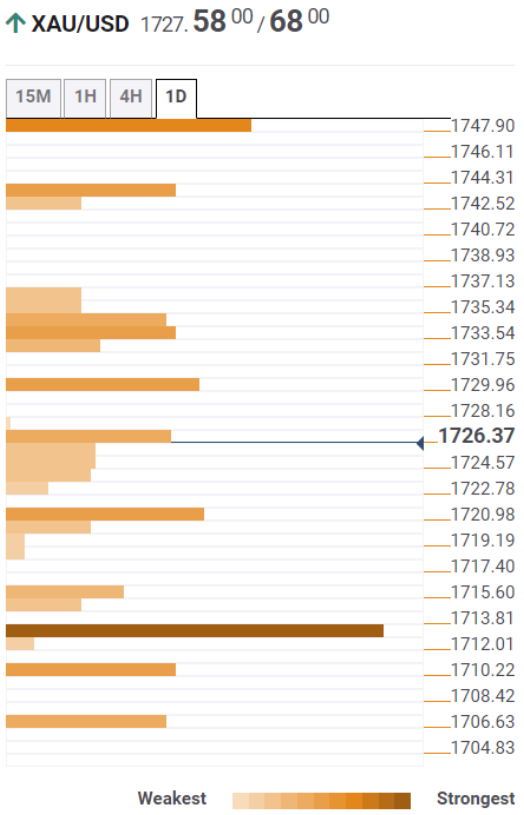
The Technical Confluence Detector shows that the gold price is looking to break above the convergence of the previous week’s high and Fibonacci 23.6% one-day at $1,729.
Next on tap for bulls is a dense cluster of healthy resistance levels stacked up around $1,735, where the Fibonacci 23.6% one-month, pivot point one-week R1 and the previous day’s high meet.
Buying pressure will accelerate above the latter, initiating a fresh upswing towards the SMA 50 one-day at $1,742.
On the flip side, the immediate support is seen at around $1,721, the confluence of the Fibonacci 23.6% one-week, Fibonacci 61.8% one-day and the previous low four-hour.
The Fibonacci 38.2% one-week at $1,716 will come to the rescue of bulls if the downside extends. The last line of defense for XAU buyers is envisioned at $1,712. At that level, the previous day’s low, SMA10 one-day and pivot point one-day S1 merge.
Here is how it looks on the tool
About Technical Confluences Detector
The TCD (Technical Confluences Detector) is a tool to locate and point out those price levels where there is a congestion of indicators, moving averages, Fibonacci levels, Pivot Points, etc. If you are a short-term trader, you will find entry points for counter-trend strategies and hunt a few points at a time. If you are a medium-to-long-term trader, this tool will allow you to know in advance the price levels where a medium-to-long-term trend may stop and rest, where to unwind positions, or where to increase your position size.
Author

Dhwani Mehta
FXStreet
Residing in Mumbai (India), Dhwani is a Senior Analyst and Manager of the Asian session at FXStreet. She has over 10 years of experience in analyzing and covering the global financial markets, with specialization in Forex and commodities markets.

















