Gold Price Forecast: XAU/USD downside opens up towards $1,764 ahead of Fed minutes – Confluence Detector
- Gold price is looking to extend the previous sell-off as the King dollar remains strong.
- Treasury yields bear the brunt of risk-aversion but fail to offer support to buyers.
- XAU/USD’s path of least resistance appears down ahead of Fed minutes.

Gold price remains vulnerable ahead of the Fed minutes, having failed to find acceptance above the $1,800 mark on several occasions. Risk-off flows dominate amid recessionary fears amplified by the Chinese activity data, keeping the sentiment around the safe-haven US dollar broadly underpinned. Despite mounting growth concerns, the Fed is widely expected to hike rates by 50 bps next month, which also continues to hurt the non-interest-bearing bullion. At the moment, However, the weakness in the US Treasury, in the wake of the flight to safety in the American government bonds, could offer temporary comfort to gold bulls. At the moment, the odds of a 50 bps September rate lift-off stand at 62%.
Also read: Gold Price Forecast: Buying intensity eases amid growth concerns
Gold Price: Key levels to watch
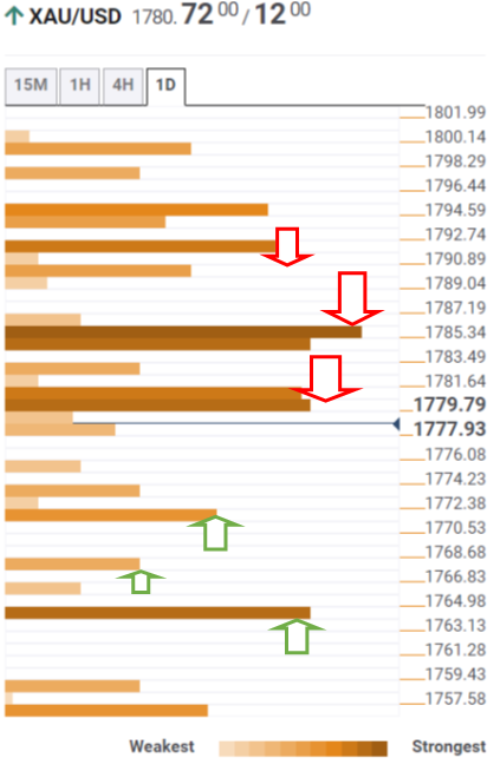
The Technical Confluence Detector shows that the gold price is gathering steam to test the previous day’s low of $1,773, below which the previous week’s low of $1,771 will be targeted.
The next downside cap is placed at $1,767, the pivot point one-day S1. The last line of defense for gold bulls is aligned at the Fibonacci 61.8% one-month at $1,764.
Alternatively, buyers need to find a strong foothold above a dense cluster of resistance levels stacked up around $1,780. At that point, the Fibonacci 23.6% one-day, SMA5 four-hour, pivot point one-week S1 and SMA10 one-hour intersect.
Further up, a powerful barrier at $1,785 will challenge the bearish commitments, above which the confluence of the Fibonacci 61.8% one-day and SMA5 one-day around $1,791 will lure buyers.
Here is how it looks on the tool
About Technical Confluences Detector
The TCD (Technical Confluences Detector) is a tool to locate and point out those price levels where there is a congestion of indicators, moving averages, Fibonacci levels, Pivot Points, etc. If you are a short-term trader, you will find entry points for counter-trend strategies and hunt a few points at a time. If you are a medium-to-long-term trader, this tool will allow you to know in advance the price levels where a medium-to-long-term trend may stop and rest, where to unwind positions, or where to increase your position size.
Author

Dhwani Mehta
FXStreet
Residing in Mumbai (India), Dhwani is a Senior Analyst and Manager of the Asian session at FXStreet. She has over 10 years of experience in analyzing and covering the global financial markets, with specialization in Forex and commodities markets.

















