Gold Price Forecast: XAU/USD bears need to crack $1,850 to unleash further downside – Confluence Detector
- Gold Price attempts a bounce on Tuesday but not out of the woods yet.
- The pullback in the US Treasury yields, dollar offer reprieve to gold bulls.
- Focus shifts towards the US inflation data, as growth and inflation fears loom.

Gold Price is attempting a minor bounce in Tuesday’s trading so far, although bulls appear less convinced as global economic growth and inflation concerns continue to haunt markets. The cautious market tone will keep the safe-haven dollar underpinned even as the Treasury yields embark upon a corrective decline. Gold Price tumbled to multi-day lows of $1,852 on Monday, as ‘sell everything’ mode engulfed markets on growth fears, triggered by the Fed’s interest rates hike, China’s covid curbs and the Ukraine crisis-led surging inflation.
Also read: Gold Price Forecast: Unbeatable dollar set to keep appreciating
Gold Price: Key levels to watch
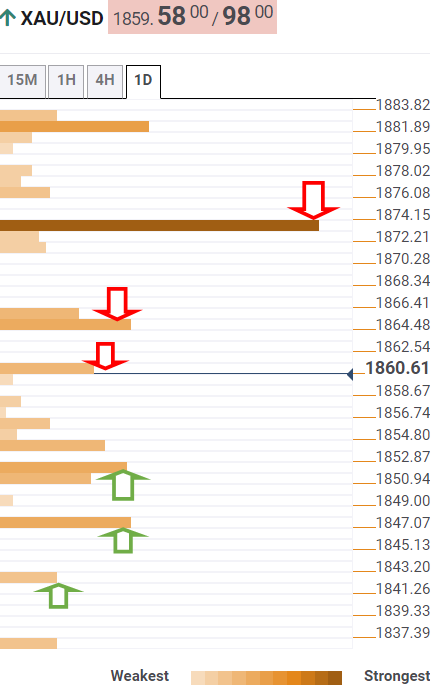
The Technical Confluences Detector shows that the Gold Price rebound is on its way to challenging a bunch of healthy resistance levels around $1,865, which is the convergence of the Fibonacci 38.2% one-day and Fibonacci 23.6% one-week.
Up next, gold bulls will have to find a strong foothold above the $1,974 powerful resistance to extend the recovery momentum. That level is the confluence of the SMA5 one-day, Fibonacci 61.8% one-day and Fibonacci 38.2% one-week.
The next relevant upside barrier is seen at the pivot point one-day R1 at $1,877, above which the SMA10 one-day at $1,882 will be the level to beat for XAUUSD buyers.
Alternatively, strong support awaits around the $1,855 region, the pivot point one-week S1.
If the selling pressure intensifies, then the confluence of the previous week’s low and the previous day’s low of $1,852 will come into play.
Further down, the psychological $1,850 level will get tested, below which gold bulls will look out for the immediate support at the pivot point one-month S1 of $1,847.
The last line of defense for gold buyers is pegged at $1,842, the pivot point one-day S1.
Here is how it looks on the tool
About Technical Confluences Detector
The TCD (Technical Confluences Detector) is a tool to locate and point out those price levels where there is a congestion of indicators, moving averages, Fibonacci levels, Pivot Points, etc. If you are a short-term trader, you will find entry points for counter-trend strategies and hunt a few points at a time. If you are a medium-to-long-term trader, this tool will allow you to know in advance the price levels where a medium-to-long-term trend may stop and rest, where to unwind positions, or where to increase your position size.
Author

Dhwani Mehta
FXStreet
Residing in Mumbai (India), Dhwani is a Senior Analyst and Manager of the Asian session at FXStreet. She has over 10 years of experience in analyzing and covering the global financial markets, with specialization in Forex and commodities markets.

















