Gold Price Forecast: Recapturing $1,901 is critical to resume Ukraine crisis-led uptrend – Confluence Detector
- Gold price eases amid calmer risk tone but Russia-Ukraine tensions remain supportive.
- All eyes on the G7 meeting, additional Western sanctions if Russia goes for a full-scale invasion.
- Gold Price awaits a fresh trigger to resume Ukraine crisis-led rally.

Gold price is treading water amid a calmer risk sentiment, as markets weigh in the recent sanctions imposed by the West to punish Russia over its aggression on East Ukraine. Further, the Ukrainian President Volodymyr Zelenskyy expecting no conflict with Russia also helped calmed nerves. The risk of a full-scale Russian invasion of Ukraine, however, remains on the table, which could help gold bulls find some comfort alongside resurfacing worries over inflation on soaring energy prices. Next of relevance for gold traders remain the G7 meeting on Thursday and the geopolitical developments surrounding the Russia-Ukraine conflict.
Read: If Russia does invade Ukraine, this could finally spark-off the crash 'puts' have been telegraphing
Gold Price: Key levels to watch
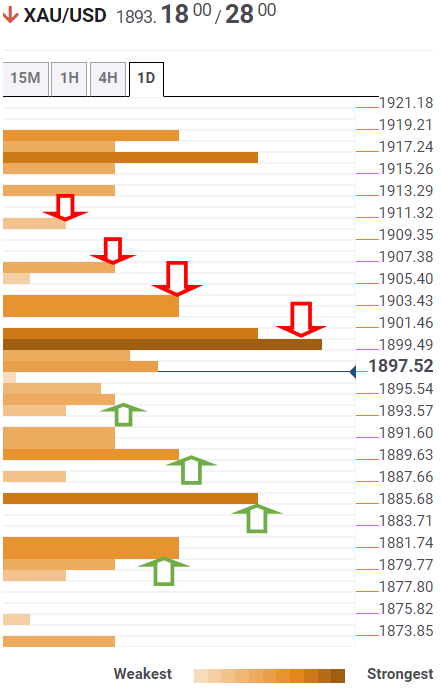
The Technical Confluences Detector shows that gold price is heading south, testing the SMA5 one-day support at $1,893 and the previous low four-hour.
If the latter is breached decisively, then the confluence of the pivot point one-day S1, Fibonacci 23.6% one-week and the previous day’s low at $1891 will come into play.
Deeper declines will expose strong support at $1,885, the pivot point one-month R2, below which floors will open up towards the Fibonacci 38.2% one-week at $1,880.
Alternatively, gold bulls need acceptance above powerful $1,901 resistance to resume the uptrend. That level is the convergence of the Fibonacci 38.2% one-day, Fibonacci 161.8% one-month and SMA5 four-hour.
The next upside hurdle is envisioned at the previous week’s high of $1,903, above which the critical Fibonacci 61.8% one-day at $1,907.
Further up, the pivot point one-day R1 at $1,913 will be the level to beat for gold bulls.
Here is how it looks on the tool
About Technical Confluences Detector
The TCD (Technical Confluences Detector) is a tool to locate and point out those price levels where there is a congestion of indicators, moving averages, Fibonacci levels, Pivot Points, etc. If you are a short-term trader, you will find entry points for counter-trend strategies and hunt a few points at a time. If you are a medium-to-long-term trader, this tool will allow you to know in advance the price levels where a medium-to-long-term trend may stop and rest, where to unwind positions, or where to increase your position size.
Author

Dhwani Mehta
FXStreet
Residing in Mumbai (India), Dhwani is a Senior Analyst and Manager of the Asian session at FXStreet. She has over 10 years of experience in analyzing and covering the global financial markets, with specialization in Forex and commodities markets.