Gold Price Forecast: Battle lines well-defined around $2,000, as focus shifts to Fed – Confluence Detector
- Gold price is trading on the defensive, as the US dollar regains poise amid risk-aversion.
- Hot US inflation and faster ECB tapering raise hawkish Fed’s expectations.
- Gold Price Forecast: XAU/USD’s downside appears capped at $1,971 amid Ukraine, inflation woes

Gold price is on the defensive near the $2,000 area heading towards the weekly closing. Risk-off mood emerged as the main market theme this week amid escalating Russia-Ukraine conflict alongside increased economic pressure from the West on Russia. Hot US inflation aggravated concerns related to stagflation. The Fed, however, is expected to embark upon its tightening cycle, despite the Ukraine uncertainty, following the ECB’s hawkish turn. All in all, the US dollar has outperformed as a safe haven asset, capping the upside potential in gold price.
Read: Central banks to continue tightening despite rising uncertainty
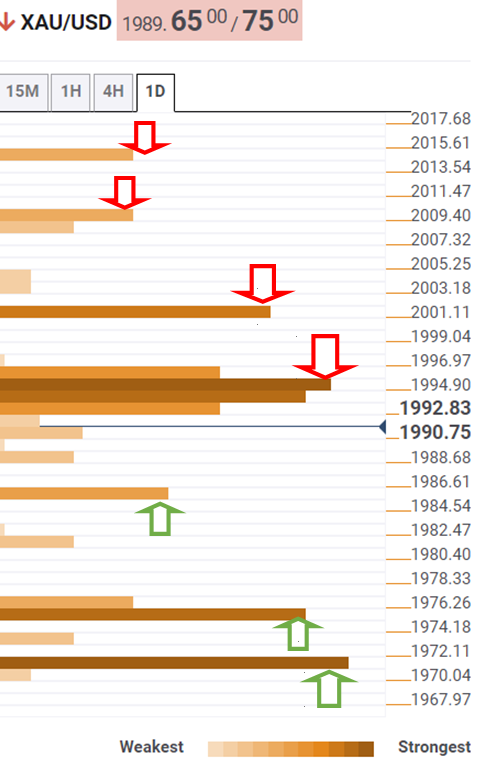
Gold Price: Key levels to watch
The Technical Confluences Detector shows that gold price is having a tough time reclaiming ground above a bunch of healthy resistance levels that align around $1,995.
The Fibonacci 38.2% one-day, SMA5 four-hour and the pivot point one-month R1 converge at that point.
If bulls find a strong foothold above the latter, then the next bullish target will be pegged at $2,002, the intersection of the SMA5 one-day and the Fibonacci 23.6% one-day.
The previous day’s high of $2,009 will then be on the sellers’ radars, above which the pivot point one-day R1 at $2,014 will get tested.
On the downside, the Fibonacci 61.8% one-day at $1,885 offers immediate support. If the bearish momentum gathers pace, then bears could target the confluence of the previous month’s high and pivot point one-day S1 at $1,975.
Further south, the meeting point of the previous week’s high and the previous day’s low near $1,970 will be a tough nut to crack for gold sellers.
Despite these relevant support and resistance levels, volatility could prop up on key updates on the Russia-Ukraine crisis. Therefore, wild swings in either direction remain well on the table.
Here is how it looks on the tool
About Technical Confluences Detector
The TCD (Technical Confluences Detector) is a tool to locate and point out those price levels where there is a congestion of indicators, moving averages, Fibonacci levels, Pivot Points, etc. If you are a short-term trader, you will find entry points for counter-trend strategies and hunt a few points at a time. If you are a medium-to-long-term trader, this tool will allow you to know in advance the price levels where a medium-to-long-term trend may stop and rest, where to unwind positions, or where to increase your position size.
Author

Dhwani Mehta
FXStreet
Residing in Mumbai (India), Dhwani is a Senior Analyst and Manager of the Asian session at FXStreet. She has over 10 years of experience in analyzing and covering the global financial markets, with specialization in Forex and commodities markets.


