Gold Price Forecast: XAU/USD’s downside appears capped at $1,971 amid Ukraine, inflation woes
- Gold sellers seem to have limited control after Thursday’s impressive rebound.
- Russia-Ukraine conflict to dominate sentiment amid resurfacing inflation concerns.
- Gold price is trapped between 21 and 50-SMAs on the 4H chart, upside appears favored.

Gold price has stalled the previous rebound on Friday, as investors digest the recent market-moving events. The European Central Bank (ECB) turned out to be relatively hawkish than expected while the US annualized inflation met estimates with 7.9% in February but at a 40-year high. The main focus point was on the peace talks between the Russian Foreign Minister Sergey Lavrov and his Ukrainian counterpart Dmytro Kuleba, which failed miserably amid a lack of progress on a ceasefire and Ukraine unwilling to give in to Russia’s demands. These event risks stoked massive risk-aversion across the financial market, triggering a fresh US dollar upswing alongside the Treasury yields.
Gold price, however, stood resilient and benefitted from resurfacing concerns over raging inflation, which provided a tailwind to the bright metal. Investors sought shelter in the ultimate hedge against inflation amid Ukraine crisis-led soaring energy prices. It remains to be seen if gold price can resume Thursday’s rebound, as the focus now turns towards the next week’s Fed meeting, with a 25-bps rate hike priced in by the market. In the meantime, the Russia-Ukraine headlines and the US Prelim UoM Consumer Sentiment data will offer fresh trading impetus to gold price. Markets will also look forward to US President Joe Biden’s national address, as he is likely to announce an end to Russia’s preferential trade status over its invasion of Ukraine.
Gold Price Chart - Technical outlook
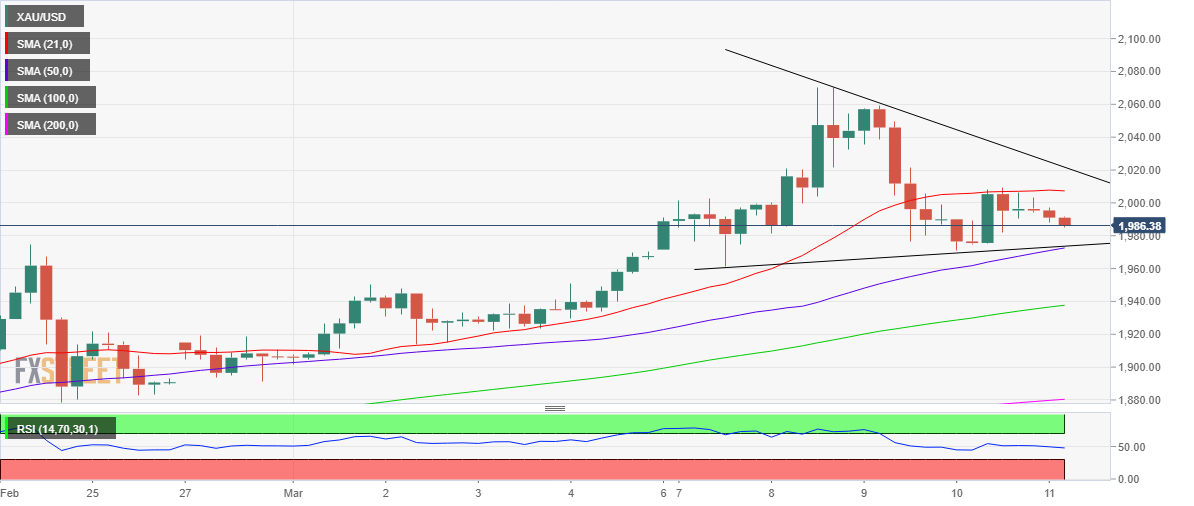
Gold: Four-hour chart
On the four-hour chart, gold price is trading close to the lower boundary of a five-day-old symmetrical triangle formation.
Meanwhile, gold bulls continue to face stiff resistance at the horizontal 21-Simple Moving Average (SMA) at $2,007.
Until the gold price yields a four-hourly candlestick closing above the latter, bears are likely to retain control.
The Relative Strength Index (RSI) has pierced through the midline, allowing room for more declines.
However, a strong cap at $1,971 will likely limit gold’s decline, as the triangle support and the upward-sloping 50-SMA converge at that level.
A firm break below that crucial support will open up the further downside towards the $1,950 psychological level, below which the ascending 100-SMA at $1,937 could be probed.
Alternatively, immediate resistance is seen at $2,000, above which bulls need to crack the 21-SMA to take on the triangle hurdle at $2,021.
The $2,050 round level could emerge as the next relevant resistance on the renewed upside.
Premium
You have reached your limit of 3 free articles for this month.
Start your subscription and get access to all our original articles.
Author

Dhwani Mehta
FXStreet
Residing in Mumbai (India), Dhwani is a Senior Analyst and Manager of the Asian session at FXStreet. She has over 10 years of experience in analyzing and covering the global financial markets, with specialization in Forex and commodities markets.


