Gold Price Analysis: XAU/USD’s rebound appears capped near $1860 amid surging yields – Confluence Detector

Gold (XAU/USD) wilted on Friday as Treasury yields surged on strengthening risk-on flows amid expectations of higher fiscal stimulus under Biden’s presidency. Prospects of a smooth transition of power in Washington eased political uncertainty, which further added to the weight on the safe-haven gold.
The metal lost $70 and touched three-week lows at $1828.62 before recovering to settle the week at $1848. The breach of the critical $1900 level accelerated the sell-off amid yields-driven US dollar’s strength, as markets shrugged-off disappointing NFP report.
In the week ahead, a fresh batch of significant US economic data and Fed Chair Jerome Powell’s speech will be eyed amid incoming stimulus and coronavirus updates.
Technically, let's see how gold is positioned starting out a fresh week?
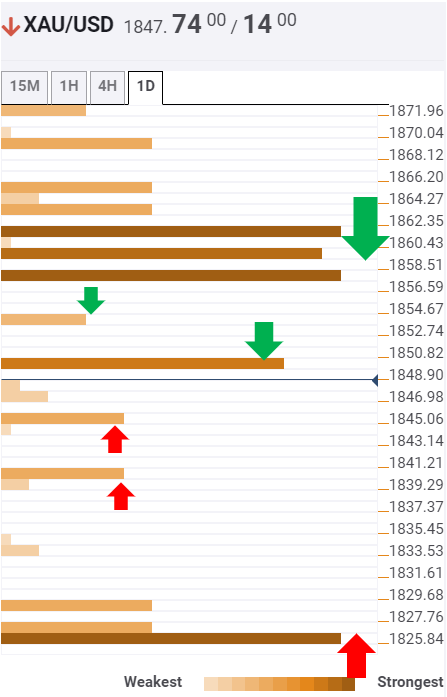
Gold Price Chart: Key resistances and supports
The Technical Confluences Indicator shows that gold closed the week just under major resistance at $1850, which is the confluence of the previous high on four-hour and Fibonacci 23.6% one-day.
A firm break above the latter is likely to highlight the next minor barrier at $1854, the Bollinger Band four-hour Lower.
Further up, a stack of healthy resistance levels is aligned around the $1858-61 region, where the SMA200 four-hour, Fibonacci 38.2% one-month and Fibonacci 23.6% one-week coincide.
The XAU bulls need to crack to the abovementioned powerful hurdle to extending the recovery from three-week lows.
To the downside, the next relevant support is seen at $1845, the previous low on four-hour. The SMA200 one-day at $1840 will be once again on the sellers’ radar.
A fresh sell-off could be in the offing if the latter is breached, putting the fierce support of $1826 at risk. That level is the Fibonacci 61.8% one-month.
Here is how it looks on the tool
About Confluence Detector
The TCI (Technical Confluences Indicator) is a tool to locate and point out those price levels where there is a congestion of indicators, moving averages, Fibonacci levels, Pivot Points, etc. Knowing where these congestion points are located is very useful for the trader, and can be used as a basis for different strategies.
Author

Dhwani Mehta
FXStreet
Residing in Mumbai (India), Dhwani is a Senior Analyst and Manager of the Asian session at FXStreet. She has over 10 years of experience in analyzing and covering the global financial markets, with specialization in Forex and commodities markets.


