|
Gold Price Analysis: XAU/USD trading off 2020 highs, holding above $1700/oz
- XAU/USD is starting the week with a modest push lower.
- The level to beat for bulls remains the 1740 resistance.

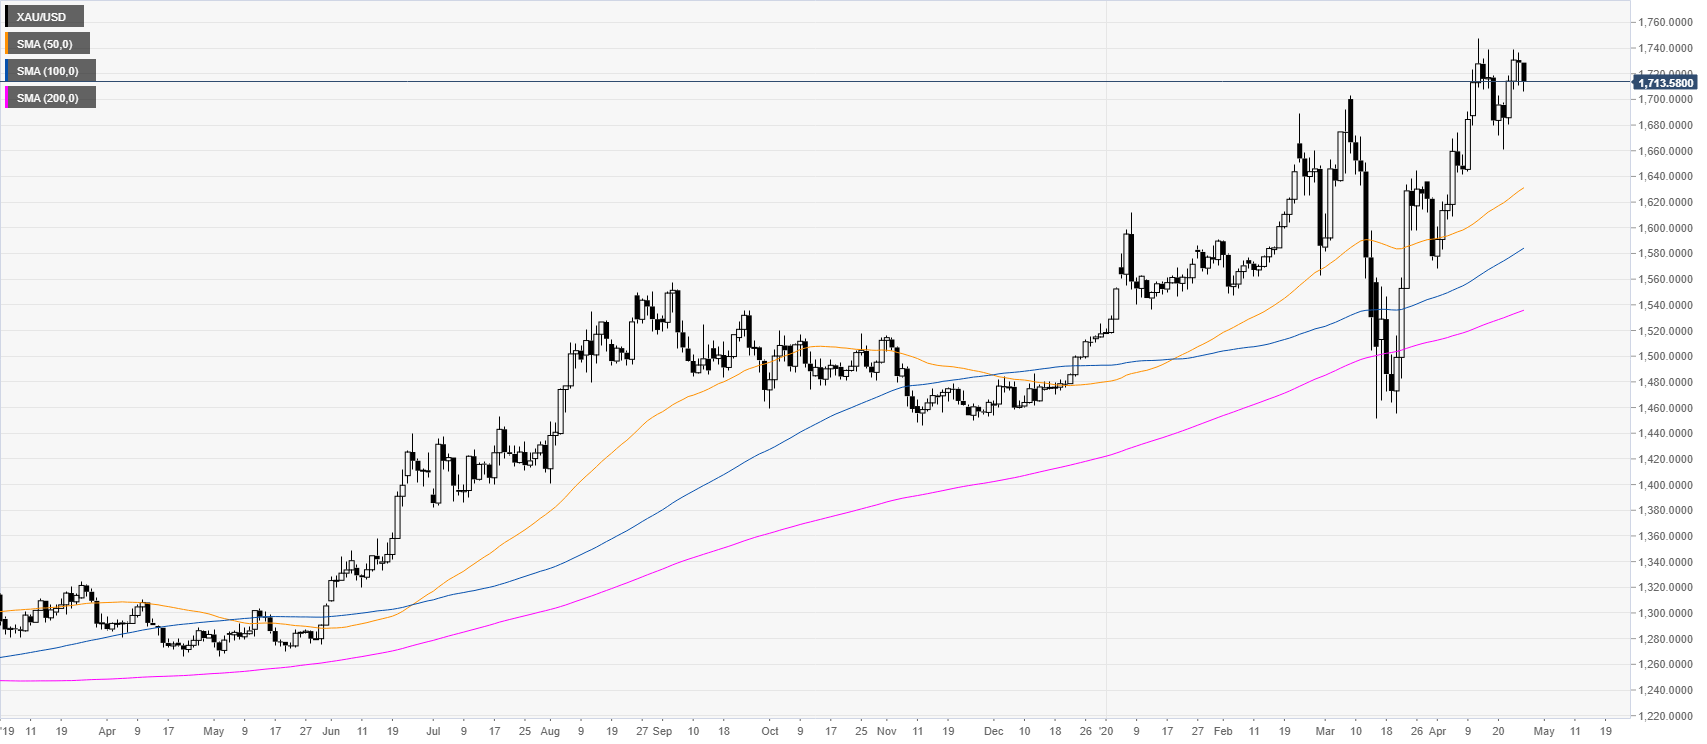
XAU/USD daily chart
Gold is trading just below the 2020 high while holding well above the main SMAs (simple moving averages) on the daily chart, suggesting a bullish bias in the long term.
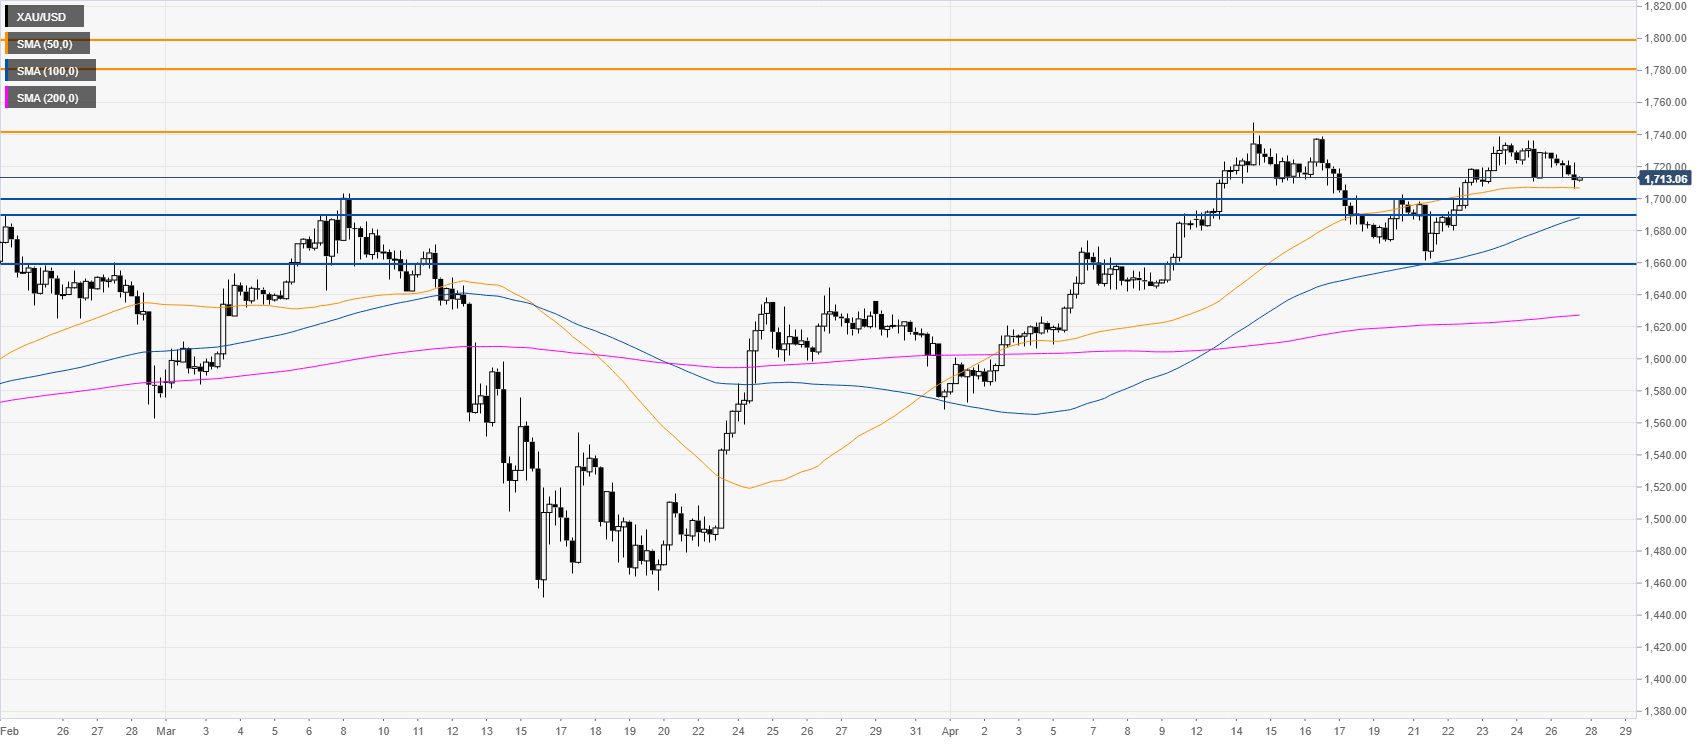
XAU/USD four-hour chart
XAU/USD is consolidating the last bullish leg while trading above the main SMAs on the four-hour chart. Although the market didn’t reach the last swing high near 1748, XAU/USD maintains a strong bullish momentum as bulls are still eyeing a break above the 1740.00 level on a daily closing basis which could open the doors toward the 1740 and 1780/1800 resistance zone. On the flip side, support is expected to hold near 1700/1690 price level in the medium-term. Further down lies the 1660 level.
Additional key levels
Author

Flavio Tosti
Independent Analyst
More from Flavio Tosti


