Gold Price Analysis: XAU/USD bulls face an uphill battle despite dovish Powell – Confluence Detector

Gold (XAU/USD) consolidates its overnight recovery above $1800, having capitalized on Fed Chair Jerome Powell’s dovish comments. Powell signaled Tuesday the Fed was nowhere close to unwinding its easy policy amid uneven economic recovery.
Gold bulls also weigh in the reports that the House will vote on the US stimulus bill this Friday, as the US Treasury yields correct further from yearly highs. Markets await the Day 2 of Powell’s testimony and a slew of Fedspeak for fresh directives.
How is positioned on the technical charts?
Gold Price Chart: Key resistances and supports
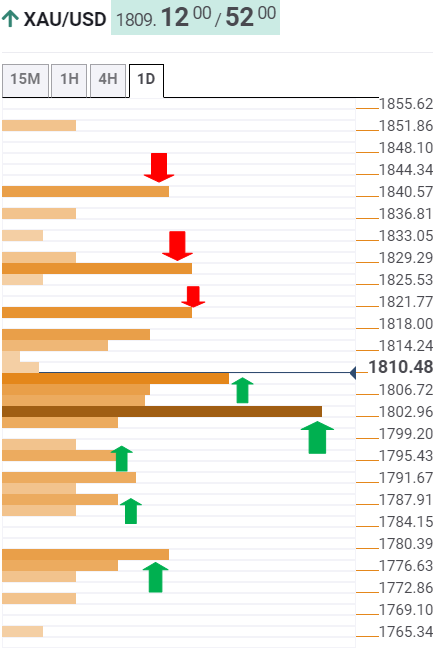
The Technical Confluences Indicator shows that gold is likely to have a tough time taking on the upside, as a bunch of healthy resistance levels is stacked up.
An immediate hurdle is seen at $1816, the previous day, above which the pivot point one-week R1 at $1818 could be tested.
Further up, the confluence of the previous week high and pivot point one-day R2 at $1827 could be challenged.
The next relevant barrier stands at $1840, the Fibonacci 23.6% one-month.
On the flip side, the XAU bulls are battling a critical $1808 cushion, where the Fibonacci 61.8% one-day, SMA10 four-hour and previous low one-hour.
Sellers would then target powerful support at $1803, the intersection of the previous month low and the Fibonacci 61.8% one-week.
The previous day low at $1796 could test the bears’ commitments, below which a dense cluster of support levels around $1790/88 could be challenged.
The last line of defense for the XAU bulls awaits at $1878, the pivot point one-month R1.
Here is how it looks on the tool
About Confluence Detector
The TCI (Technical Confluences Indicator) is a tool to locate and point out those price levels where there is a congestion of indicators, moving averages, Fibonacci levels, Pivot Points, etc. Knowing where these congestion points are located is very useful for the trader, and can be used as a basis for different strategies.
Author

Dhwani Mehta
FXStreet
Residing in Mumbai (India), Dhwani is a Senior Analyst and Manager of the Asian session at FXStreet. She has over 10 years of experience in analyzing and covering the global financial markets, with specialization in Forex and commodities markets.


