Gold Price Analysis: Key levels to watch ahead of Fed, upside still favored – Confluence Detector

Gold (XAU/USD) treads water around $1950, as the bulls turn cautious in the run-up to the Fed showdown. The dovish Fed expectations amid coronavirus-led economic risks and US fiscal stand-off keep the upside favored in the yellow metal.
The buyers, however, await a fresh impetus for the next push higher, especially after a volatile session seen on Tuesday. Gold rallied to life-time highs of $1981.34 before correcting sharply to $1907. The bulls fought back control, as the price settled the day above $1950 levels.
The risk trends continue to remain in play amid a broadly subdued US dollar, as it wallows near two-year lows across its main competitors and lends support to the precious metal. Let’s look at the Technical Confluences Indicator to gauge how the metal is positioned heading into the Fed decision.
Key resistances and supports
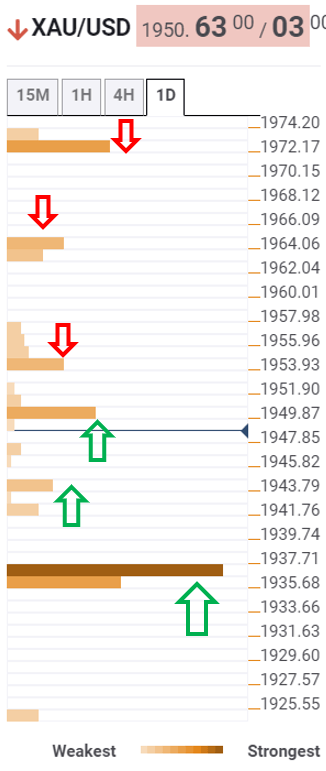
The tool shows that the bright metal is on track to test the powerful support aligned at $1937, where the pivot point one-month R3, pivot point one-week R1 and Fibonacci 61.8% one-day converge. That level will be a tough nut to crack for the sellers.
Ahead of that key support, the bears could test the downside cushion at $1943, which is the confluence of the SMA10 four-hour and SMA50 one-hour.
To the upside, the Fibonacci 38.2% one-day hurdle at $1954 offers immediate resistance. Acceptance above the latter will open doors towards $1964. The Fibonacci 23.6% one-day.
Buyers will then aim for $1972, the intersection of the Bolling Band one-hour Upper and pivot point one-week R2, en route the record highs of $1981.34 reached on Tuesday.
The path of least resistance appears to the upside amid dovish Fed expectations.
Here is how it looks on the tool
About the Confluence Detector
The TCI (Technical Confluences Indicator) is a tool to locate and point out those price levels where there is a congestion of indicators, moving averages, Fibonacci levels, Pivot Points, etc. Knowing where these congestion points are located is very useful for the trader, and can be used as a basis for different strategies.
Author

Dhwani Mehta
FXStreet
Residing in Mumbai (India), Dhwani is a Senior Analyst and Manager of the Asian session at FXStreet. She has over 10 years of experience in analyzing and covering the global financial markets, with specialization in Forex and commodities markets.















