|

GBPJPY Price Analysis: Sellers in charge, as head-and-shoulders pattern emerged

  • GBPJPY trims some of its Thursday losses as the Asian session starts.
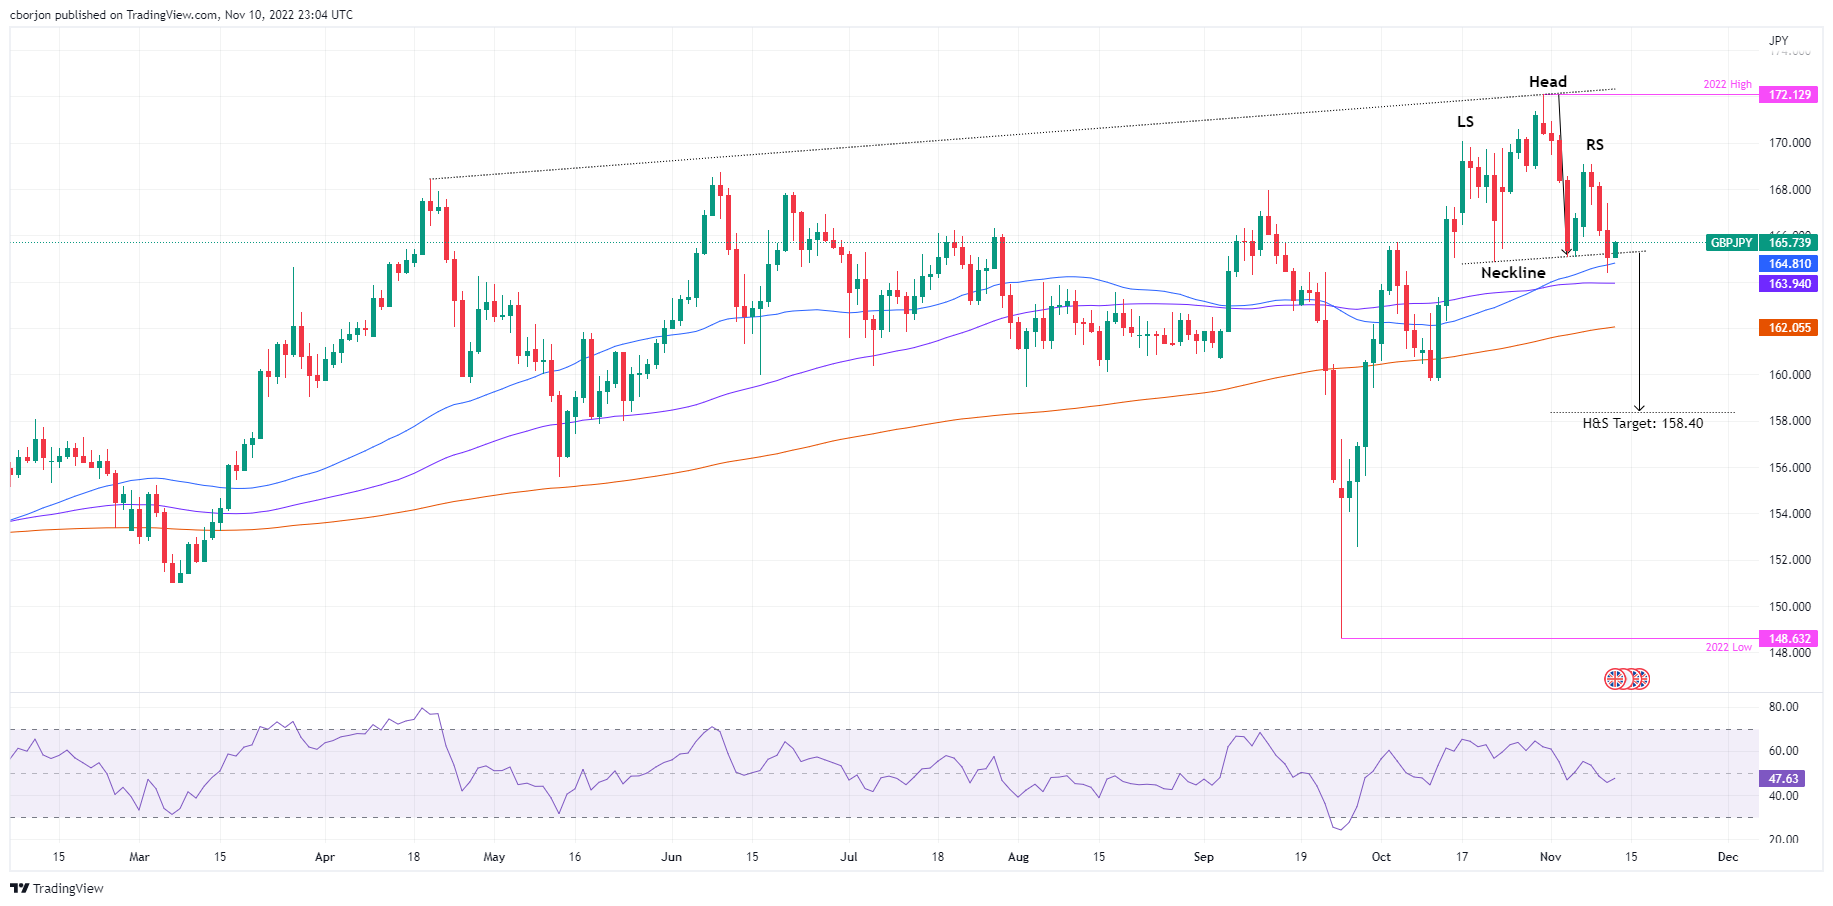
  • A head-and-shoulders chart pattern in the GBPJPY daily chart targets a fall to 158.40.
  • GBPJPY Price Analysis: A rise above 169.00 would invalidate the pattern; otherwise, the downtrend will resume.

The GBPJPY extended its losses for three consecutive days following the release of the US inflation report, which triggered a US Dollar (USD) sell-off. Therefore, the USDJPY sank more than 500 pips and weighed on the Pound Sterling, which weakened 0.71% vs. the Japanese Yen (JPY) on Thursday. As the Asian session begins, the GBPJPY trades at 165.76 and stages a comeback, pairing some of Thursday’s losses.

GBPJPY Price Analysis: Technical outlook

On Thursday, the GBPJPY pierced the 50-day Exponential Moving Average (EMA) but bounced off, achieving a daily close above 165.00. GBPJPY price action during the last 30 days formed a head-and-shoulders chart pattern, though, at the time of typing, the cross exchanges hands above the neckline. Nevertheless, to invalidate the pattern, the GBP needs to lift the cross above the right-shoulder swing high at 169.00. Otherwise, if the GBPJPY resumes its downward path below the neckline, which passes at around 165.30, it would validate the head-and-shoulders chart pattern.

Therefore, the GBPJPY’s first support would be the psychological 165.00 figure. Break below will expose the 50-day EMA at 164.80, followed by the November 10 swing low at 164.36, ahead of the 164.00 mark. Once cleared, the following demand area will be the 100-day EMA at 163.95, on its way, towards the head-and-shoulders target of 158.00.

GBPJPY Key Technical Levels

GBP/JPY

Overview
Today last price165.76
Today Daily Change-0.54
Today Daily Change %-0.32
Today daily open166.3
 
Trends
Daily SMA20168.38
Daily SMA50164.7
Daily SMA100164
Daily SMA200162.02
 
Levels
Previous Daily High168.32
Previous Daily Low165.97
Previous Weekly High172.14
Previous Weekly Low165.09
Previous Monthly High172.14
Previous Monthly Low159.73
Daily Fibonacci 38.2%166.87
Daily Fibonacci 61.8%167.42
Daily Pivot Point S1165.4
Daily Pivot Point S2164.5
Daily Pivot Point S3163.04
Daily Pivot Point R1167.76
Daily Pivot Point R2169.22
Daily Pivot Point R3170.12

Author

Christian Borjon Valencia

Christian Borjon began his career as a retail trader in 2010, mainly focused on technical analysis and strategies around it. He started as a swing trader, as he used to work in another industry unrelated to the financial markets.

More from Christian Borjon Valencia
Share:

Markets move fast. We move first.

Orange Juice Newsletter brings you expert driven insights - not headlines. Every day on your inbox.

By subscribing you agree to our Terms and conditions.

Editor's Picks

EUR/USD rebounds after falling toward 1.1700

EUR/USD gains traction and trades above 1.1730 in the American session, looking to end the week virtually unchanged. The bullish opening in Wall Street makes it difficult for the US Dollar to preserve its recovery momentum and helps the pair rebound heading into the weekend.

GBP/USD steadies below 1.3400 as traders assess BoE policy outlook

Following Thursday's volatile session, GBP/USD moves sideways below 1.3400 on Friday. Investors reassess the Bank of England's policy oıtlook after the MPC decided to cut the interest rate by 25 bps by a slim margin. Meanwhile, the improving risk mood helps the pair hold its ground.

Gold stays below $4,350, looks to post small weekly gains

Gold struggles to gather recovery momentum and stays below $4,350 in the second half of the day on Friday, as the benchmark 10-year US Treasury bond yield edges higher. Nevertheless, the precious metal remains on track to end the week with modest gains as markets gear up for the holiday season.

Crypto Today: Bitcoin, Ethereum, XRP rebound amid bearish market conditions

Bitcoin (BTC) is edging higher, trading above $88,000 at the time of writing on Monday. Altcoins, including Ethereum (ETH) and Ripple (XRP), are following in BTC’s footsteps, experiencing relief rebounds following a volatile week.

How much can one month of soft inflation change the Fed’s mind?

One month of softer inflation data is rarely enough to shift Federal Reserve policy on its own, but in a market highly sensitive to every data point, even a single reading can reshape expectations. November’s inflation report offered a welcome sign of cooling price pressures. 

XRP rebounds amid ETF inflows and declining retail demand demand

XRP rebounds as bulls target a short-term breakout above $2.00 on Friday. XRP ETFs record the highest inflow since December 8, signaling growing institutional appetite.