GBP/USD Technical Analysis: Sterling ending the week near 1.2930 level

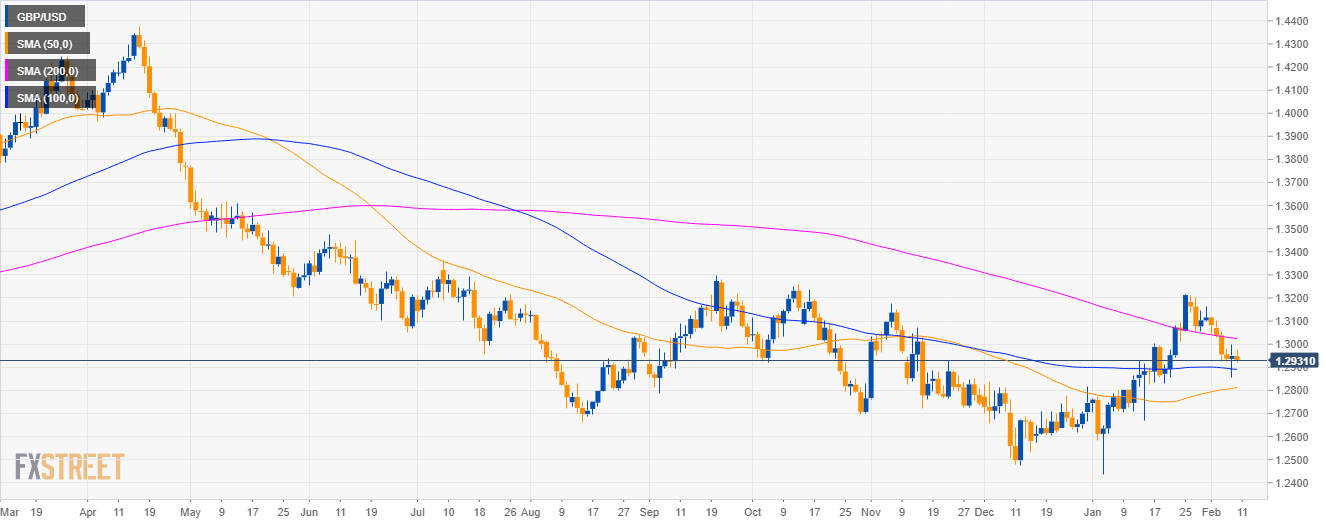
GBP/USD daily chart
- GBP/USD is trading in a bear trend below the 200-day simple moving average (SMA).
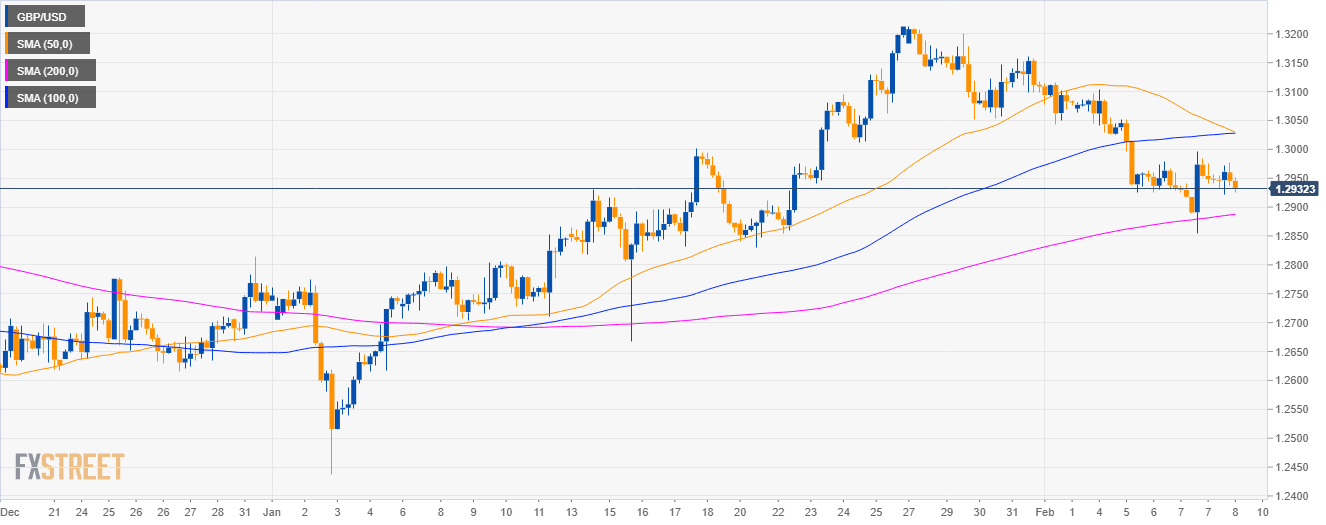
GBP/USD 4-hour chart
- GBP/USD is trading between the 100 and 200 SMA suggesting a sideways market in the medium-term.
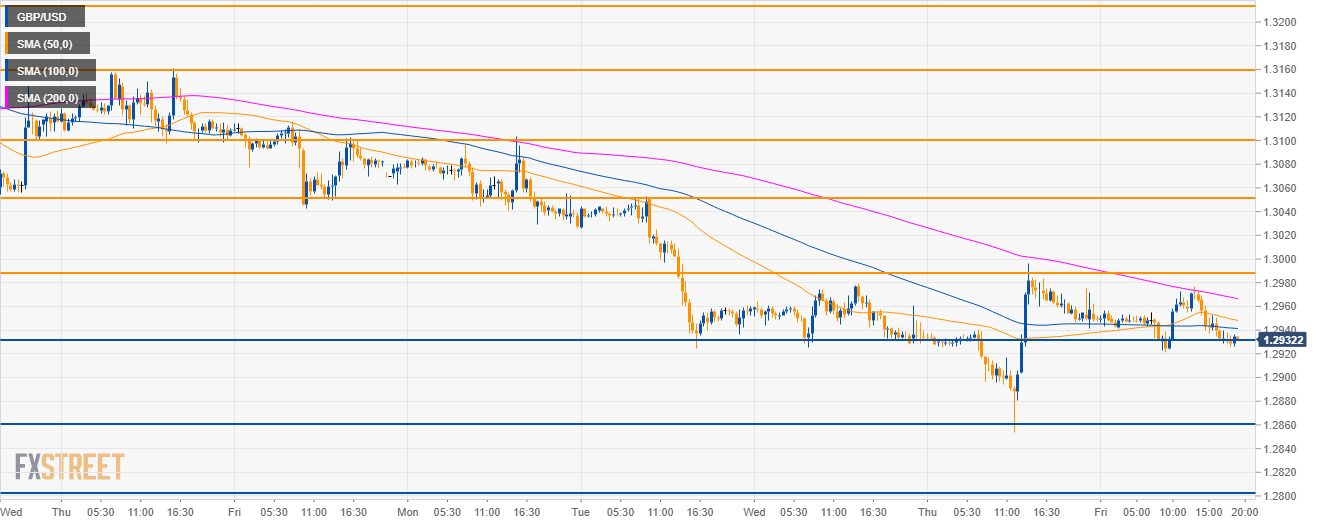
GBP/USD 30-minute chart
- GBP/USD is trading below its main SMAs suggesting bearish momentum in the short-term.
- A breakdown below the 1.2930 support could lead to a drop to 1.2860 and 1.2800 figure.
- The level to beat for bulls is 1.2990 resistance in order to target 1.3050 to the upside.
Additional key levels
GBP/USD
Overview:
Today Last Price: 1.2934
Today Daily change: -15 pips
Today Daily change %: -0.12%
Today Daily Open: 1.2949
Trends:
Daily SMA20: 1.2997
Daily SMA50: 1.2808
Daily SMA100: 1.2892
Daily SMA200: 1.3027
Levels:
Previous Daily High: 1.2997
Previous Daily Low: 1.2854
Previous Weekly High: 1.3212
Previous Weekly Low: 1.3043
Previous Monthly High: 1.3214
Previous Monthly Low: 1.2438
Daily Fibonacci 38.2%: 1.2942
Daily Fibonacci 61.8%: 1.2908
Daily Pivot Point S1: 1.287
Daily Pivot Point S2: 1.2791
Daily Pivot Point S3: 1.2727
Daily Pivot Point R1: 1.3012
Daily Pivot Point R2: 1.3076
Daily Pivot Point R3: 1.3155
Author

Flavio Tosti
Independent Analyst


