GBP/USD Technical Analysis: Short-side looking for a new weekly low at 1.3080
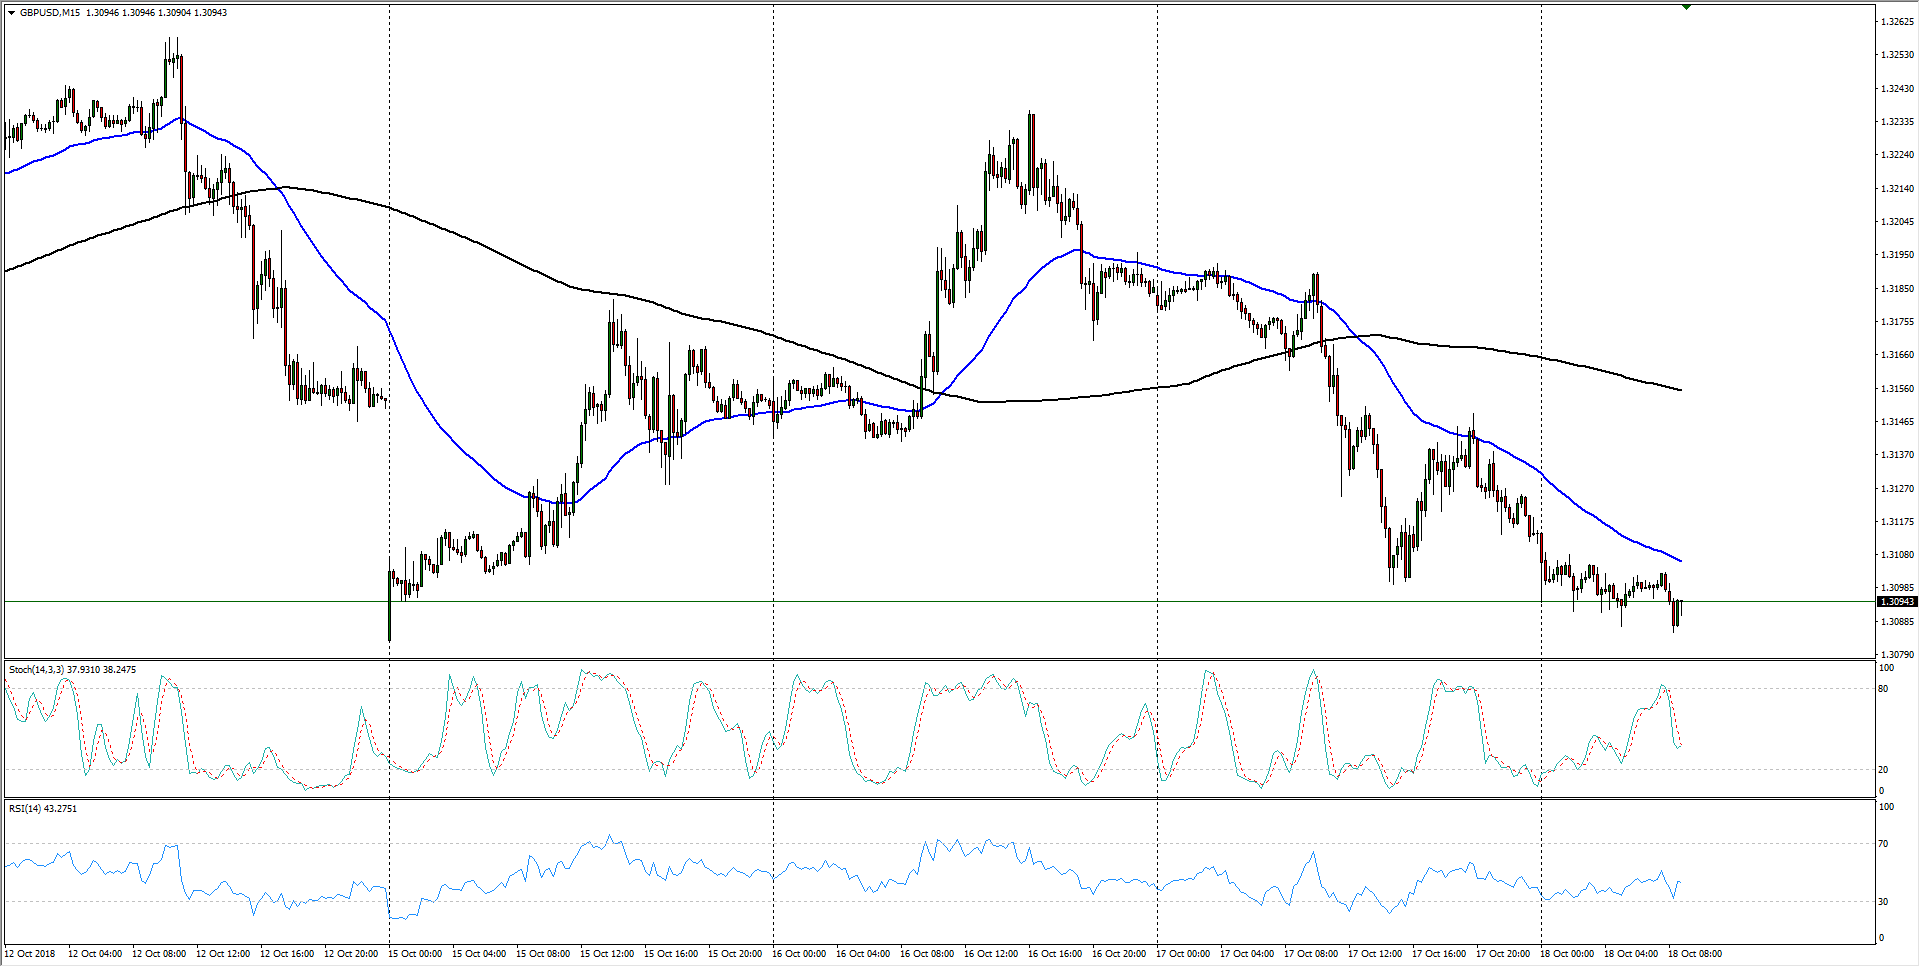
- The GBP/USD is shifting into the downside just south of 1.3100 as the Sterling continues to weaken against the USD.
- Hourly candles show the pair has broken below the 200-hour moving average, and the Cable is now challenging the week's bottom at 1.3083.
- 1-Hour technical indicators are pinning into oversold territory, and the Cable could be primed for a hop back up to the 200-hour moving average at 1.3150 before continuing lower.
GBP/USD
Overview:
Last Price: 1.3095
Daily change: -21 pips
Daily change: -0.160%
Daily Open: 1.3116
Trends:
Daily SMA20: 1.3114
Daily SMA50: 1.2995
Daily SMA100: 1.3097
Daily SMA200: 1.3485
Levels:
Daily High: 1.3194
Daily Low: 1.3099
Weekly High: 1.326
Weekly Low: 1.3028
Monthly High: 1.33
Monthly Low: 1.2922
Daily Fibonacci 38.2%: 1.3136
Daily Fibonacci 61.8%: 1.3158
Daily Pivot Point S1: 1.3078
Daily Pivot Point S2: 1.3041
Daily Pivot Point S3: 1.2983
Daily Pivot Point R1: 1.3174
Daily Pivot Point R2: 1.3232
Daily Pivot Point R3: 1.3269
Author

Joshua Gibson
FXStreet
Joshua joins the FXStreet team as an Economics and Finance double major from Vancouver Island University with twelve years' experience as an independent trader focusing on technical analysis.


