|

GBP/USD technical analysis: Cable trading at daily lows, challenging the 1.2900 figure

  • GBP/USD is retracing down from the daily highs, now challenging the 1.2900 handle. 
  • Brexit headlines are the main Cable drivers.
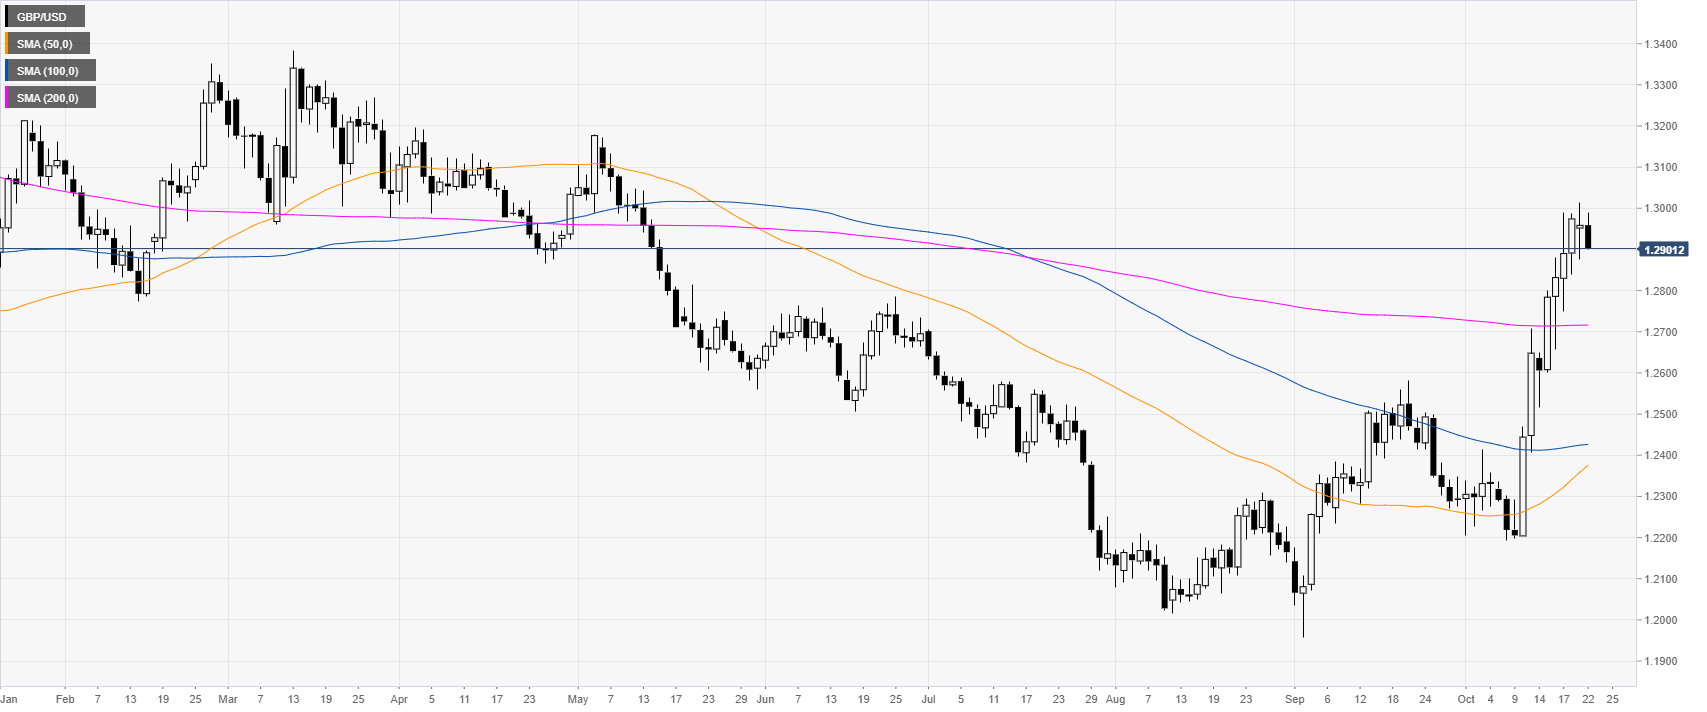


GBP/USD daily chart


The Sterling, on the daily chart, had a spike above the main daily simple moving averages (DSMAs) while reaching levels not seen since mid-May 2019. The Brexit deal optimism fuelled the GBP euphoria of the last weeks.


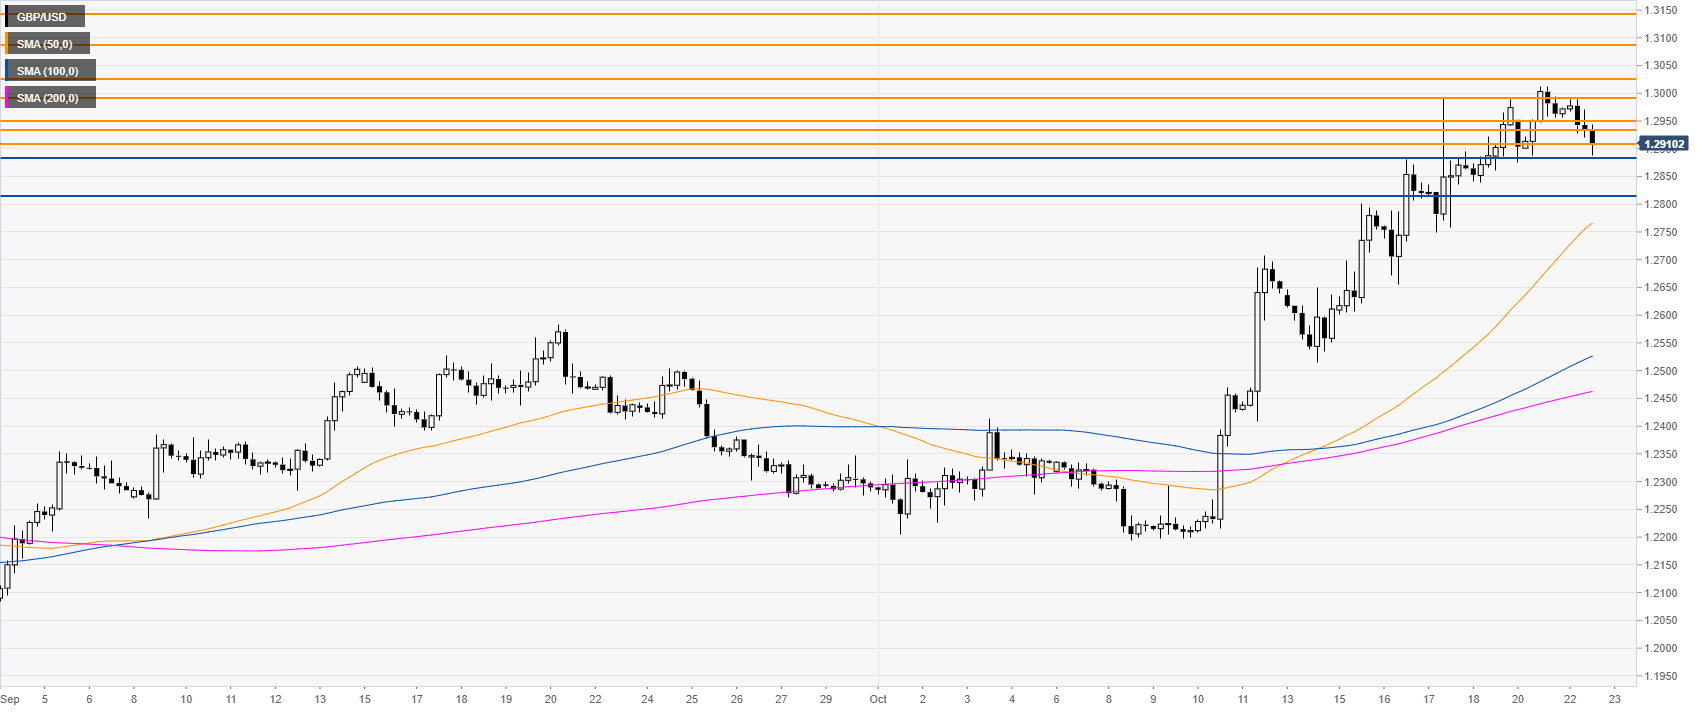
GBP/USD four-hour chart

 
The Cable is trading in a bull channel above the main SMAs. However, the market is retracing down now, challenging the 1.2881 support level, according to the Technical Confluences Indicator


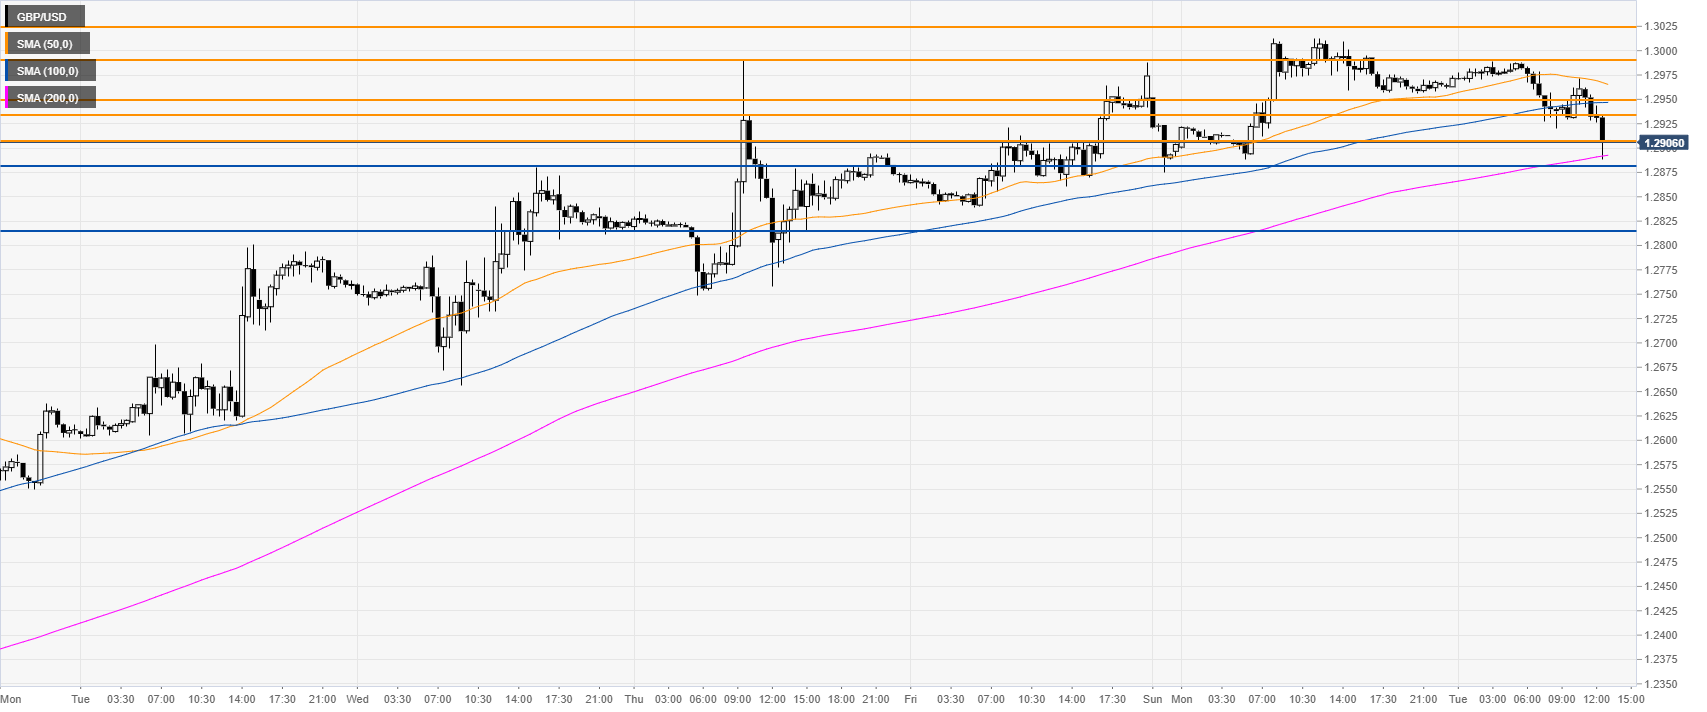
GBP/USD 30-minute chart


GBP/USD is challenging the 200 SMA, suggesting a pullback down in the near term. If bears can break 1.2881, then the market could have a drop towards the 1.2814 level, according to the Technical Confluences Indicator. 
 
On the flip side, if the spot regains the 1.2950 resistance, it can open the doors to a retest of the 1.3000 handle. 
  

Additional key levels

GBP/USD

Overview
Today last price1.2901
Today Daily Change-0.0057
Today Daily Change %-0.44
Today daily open1.2958
 
Trends
Daily SMA201.2493
Daily SMA501.2359
Daily SMA1001.2424
Daily SMA2001.2716
 
Levels
Previous Daily High1.3013
Previous Daily Low1.2875
Previous Weekly High1.299
Previous Weekly Low1.2515
Previous Monthly High1.2583
Previous Monthly Low1.1958
Daily Fibonacci 38.2%1.296
Daily Fibonacci 61.8%1.2928
Daily Pivot Point S11.2884
Daily Pivot Point S21.281
Daily Pivot Point S31.2746
Daily Pivot Point R11.3023
Daily Pivot Point R21.3087
Daily Pivot Point R31.3161

Author

Flavio Tosti

Flavio Tosti

Independent Analyst


More from Flavio Tosti
Share:

Editor's Picks

EUR/USD remains below 1.1850 after US data

EUR/USD struggles to gain traction and trades in a narrow range below 1.1850 on Wednesday. The US Dollar stays resilient against its rivals following the better-than-expected Durable Goods Orders and housing data, limiting the pair's upside ahead of FOMC Minutes. 

GBP/USD stays in narrow channel above 1.3550 ahead of FOMC Minutes

GBP/USD holds its ground following Tuesday's slide and moves sideways above 1.3550 midweek. Although the data from the UK confirmed that inflation cooled in January, the positive shift seen in market mood helps the pair keep its footing as investors wait for the Fed to publish the minnutes of the January policy meeting.

Gold regains some shine, retargets $5,000 ahead of FOMC Minutes

Gold gathers fresh upside traction on Wednesday, leaving part of the weakness seen at the beginning of the week and refocusing its attention to the key $5,000 mark per troy ounce, all ahead of the release of the FOMC Minutes and despite the modest uptick in the US Dollar.

Pi Network rally defies market pressure ahead of its first anniversary

Pi Network is trading above $0.1900 at press time on Wednesday, extending the weekly gains by nearly 8% so far. The steady recovery is supported by a short-term pause in mainnet migration, which reduces pressure on the PI token supply for Centralized Exchanges. The technical outlook focuses on the $0.1919 resistance as bullish momentum increases.

Mixed UK inflation data no gamechanger for the Bank of England

Food inflation plunged in January, but service sector price pressure is proving stickier. We continue to expect Bank of England rate cuts in March and June. The latest UK inflation read is a mixed bag for the Bank of England, but we doubt it drastically changes the odds of a March rate cut.

Top 3 Price Prediction: Bitcoin, Ethereum, and Ripple face downside risk as bears regain control

Bitcoin, Ethereum, and Ripple remain under pressure on Wednesday, with the broader trend still sideways. BTC is edging below $68,000, nearing the lower consolidating boundary, while ETH and XRP also declined slightly, approaching their key supports.